Enhance the endurance race experience for both the athlete and spectators.
Challenge
Prove the market exists for a product that improves the experience athletes and spectators have when planning and communicating race logistics before, during, and after an endurance race.
Role
UX Researcher and Design
Action
- Define the purpose, goals, and outcomes of the research.
- Identify target audiences and their demographics, behaviors, motivations, goals, and tools for each group.
- Determine direct and indirect competitors and conduct competitor analysis and usability tests.
- Create a comprehensive research plan, including all required materials and participant recruitment strategies for conducting field visits, exploratory interviews, and validation surveys to accurately identify and validate the pain points of each user group.
- Synthesize data into affinity diagrams identifying patterns, trends, key takeaways, and recommendations for improving the experience for each user group.
- Mock-up user flows and prototype screens to effectively communicate the research outcomes.
- Produce a comprehensive report including all research findings, key insights, and actionable recommendations.
- Present the findings to stakeholders and user groups.
- Identify additional research to explore new questions, additional user groups, and monetization opportunities.
Results
Confirm market exists for proposed APP. Final product recommendations presented and delivered to area race directors.
Deliverables
Full Research Plan:
- Audience Profiles
- Competitor Analysis
- Usability Testing
- Exploratory Interviews
- Affinity Diagrams
- Validation Survey
- Field Study
- Persona Creation
- User Scenarios
- Journey Maps
- User Flows
- Final Recommendations
- Presentation
Audience Research
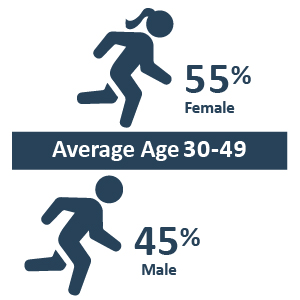
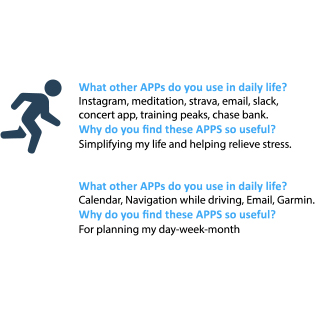
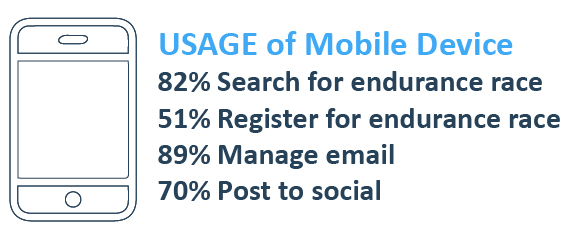
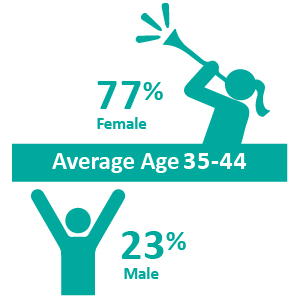
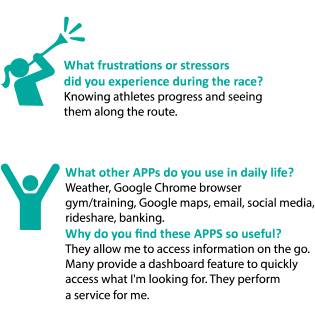
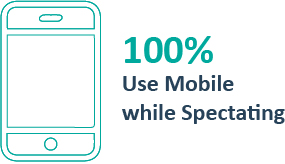
Research conducted through surveys and phone interviews strongly validated the need for the product. It provided valuable insights into the demographics, current mobile app usage, and technology adoption rate among the target audiences.
Competitor Analysis
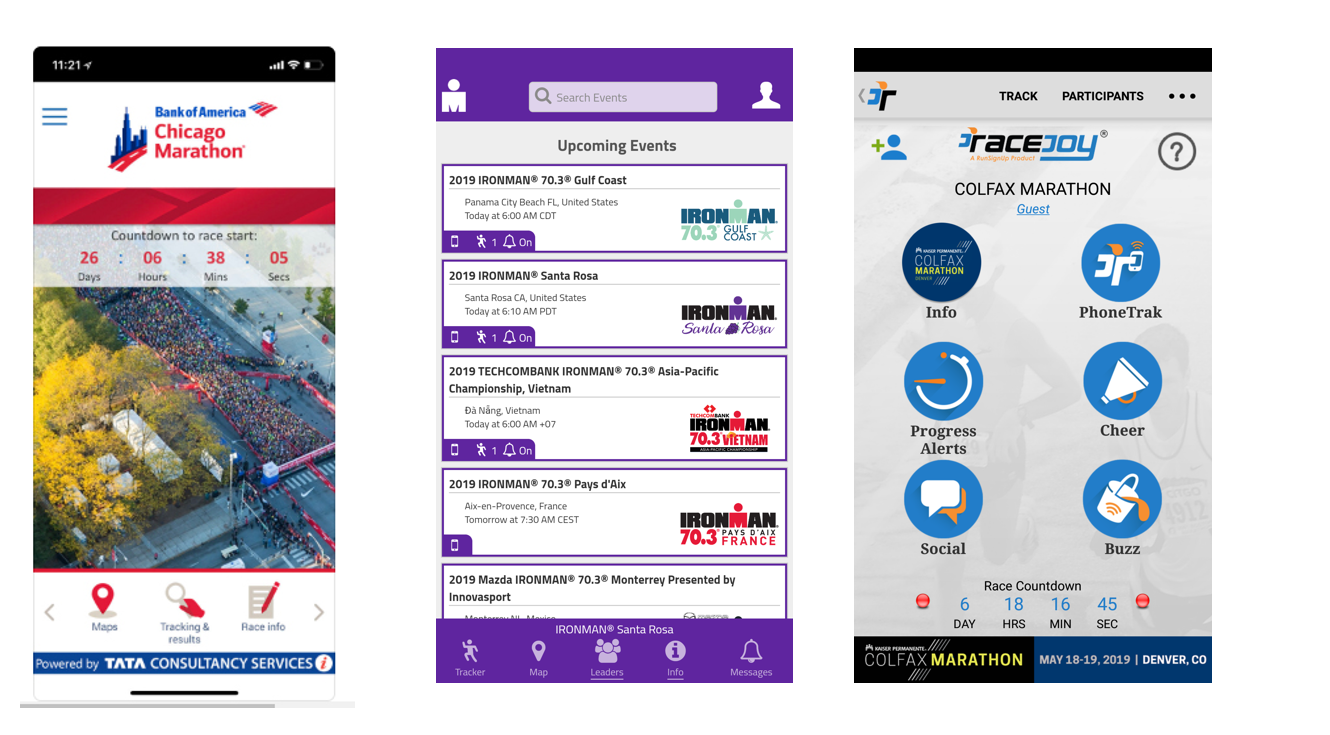
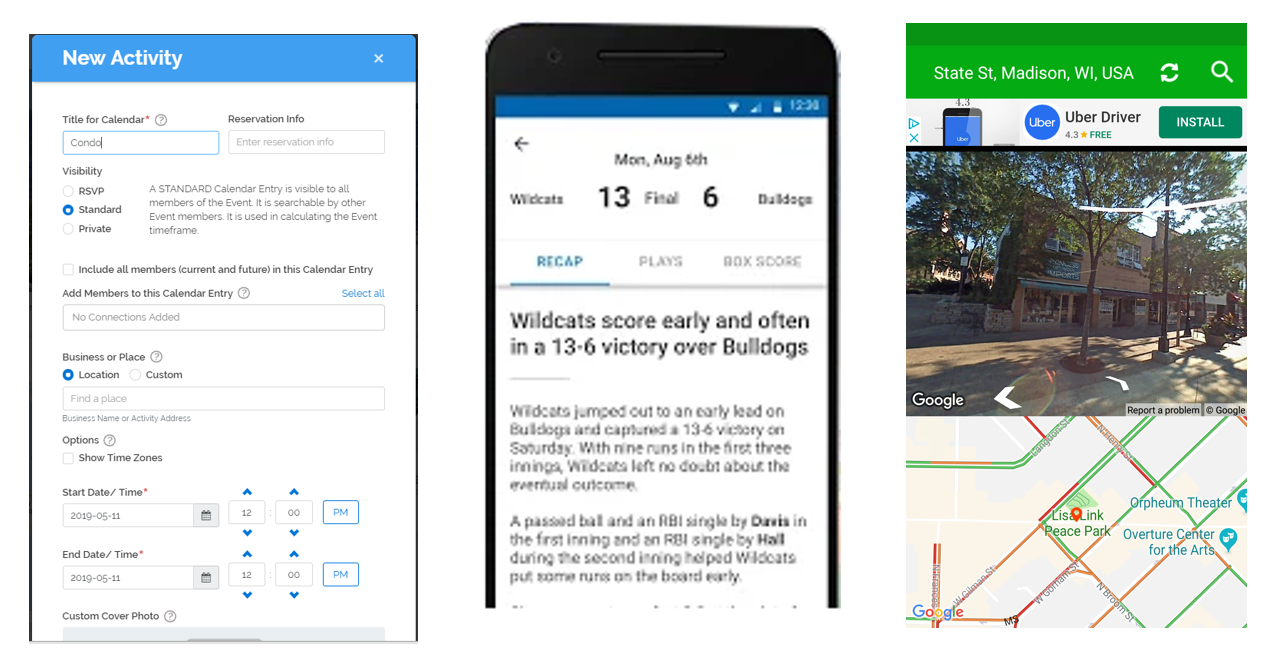
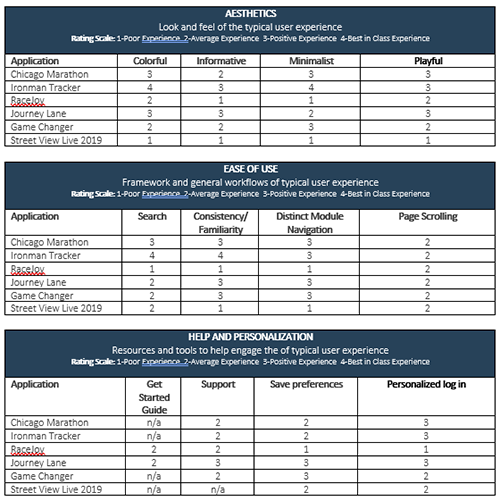
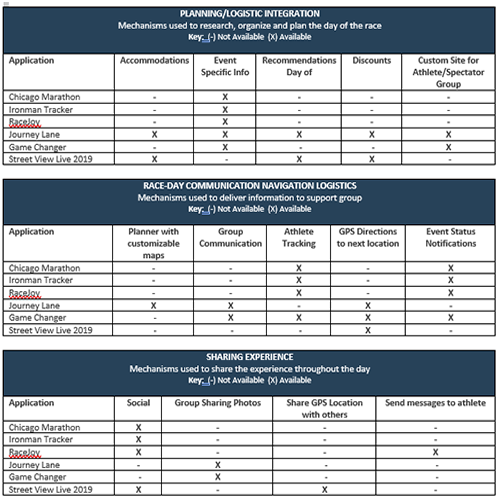
- The analysis examined direct and indirect competitor applications that shared similar audiences and features as the proposed application.
- The proposed application offers a range of features that make it highly competitive in the market, including Race Day Athlete Tracking, Status Notifications, Social Features, Navigation, Event Management, and Communication Tools.
Research
Several research methods were employed to gain proper understanding and validation for both target audiences: endurance athletes and endurance race spectators.
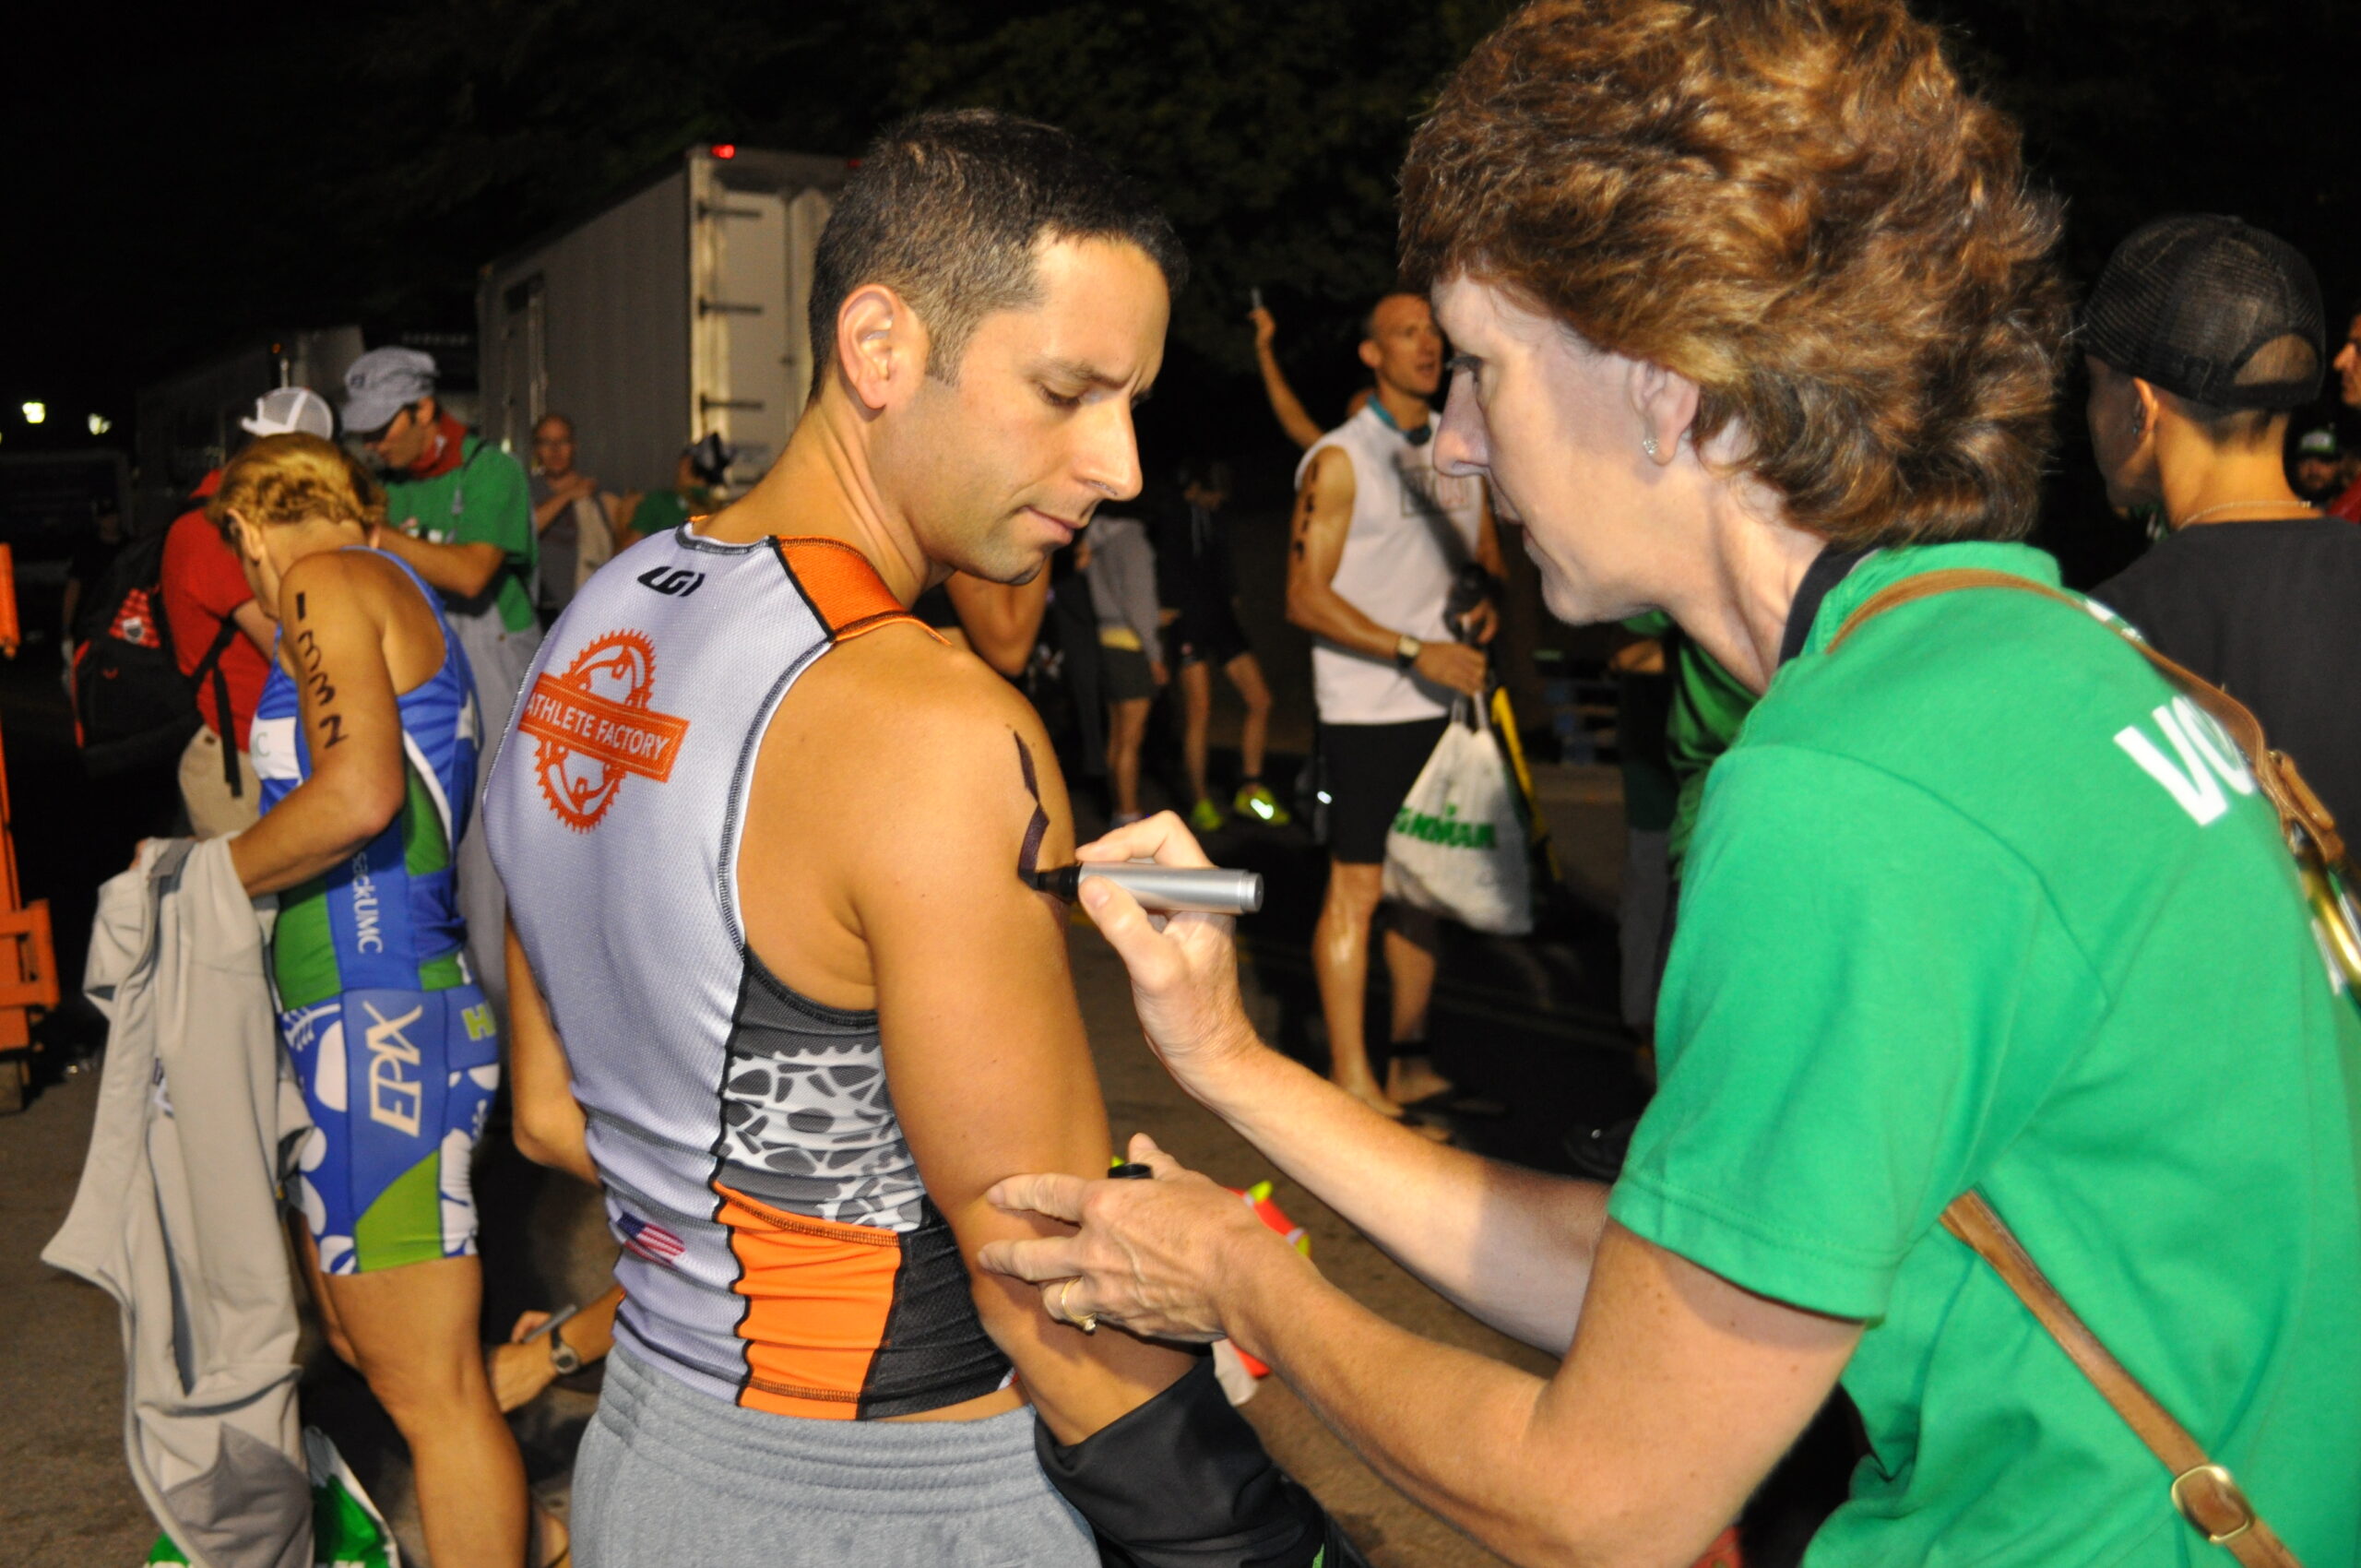
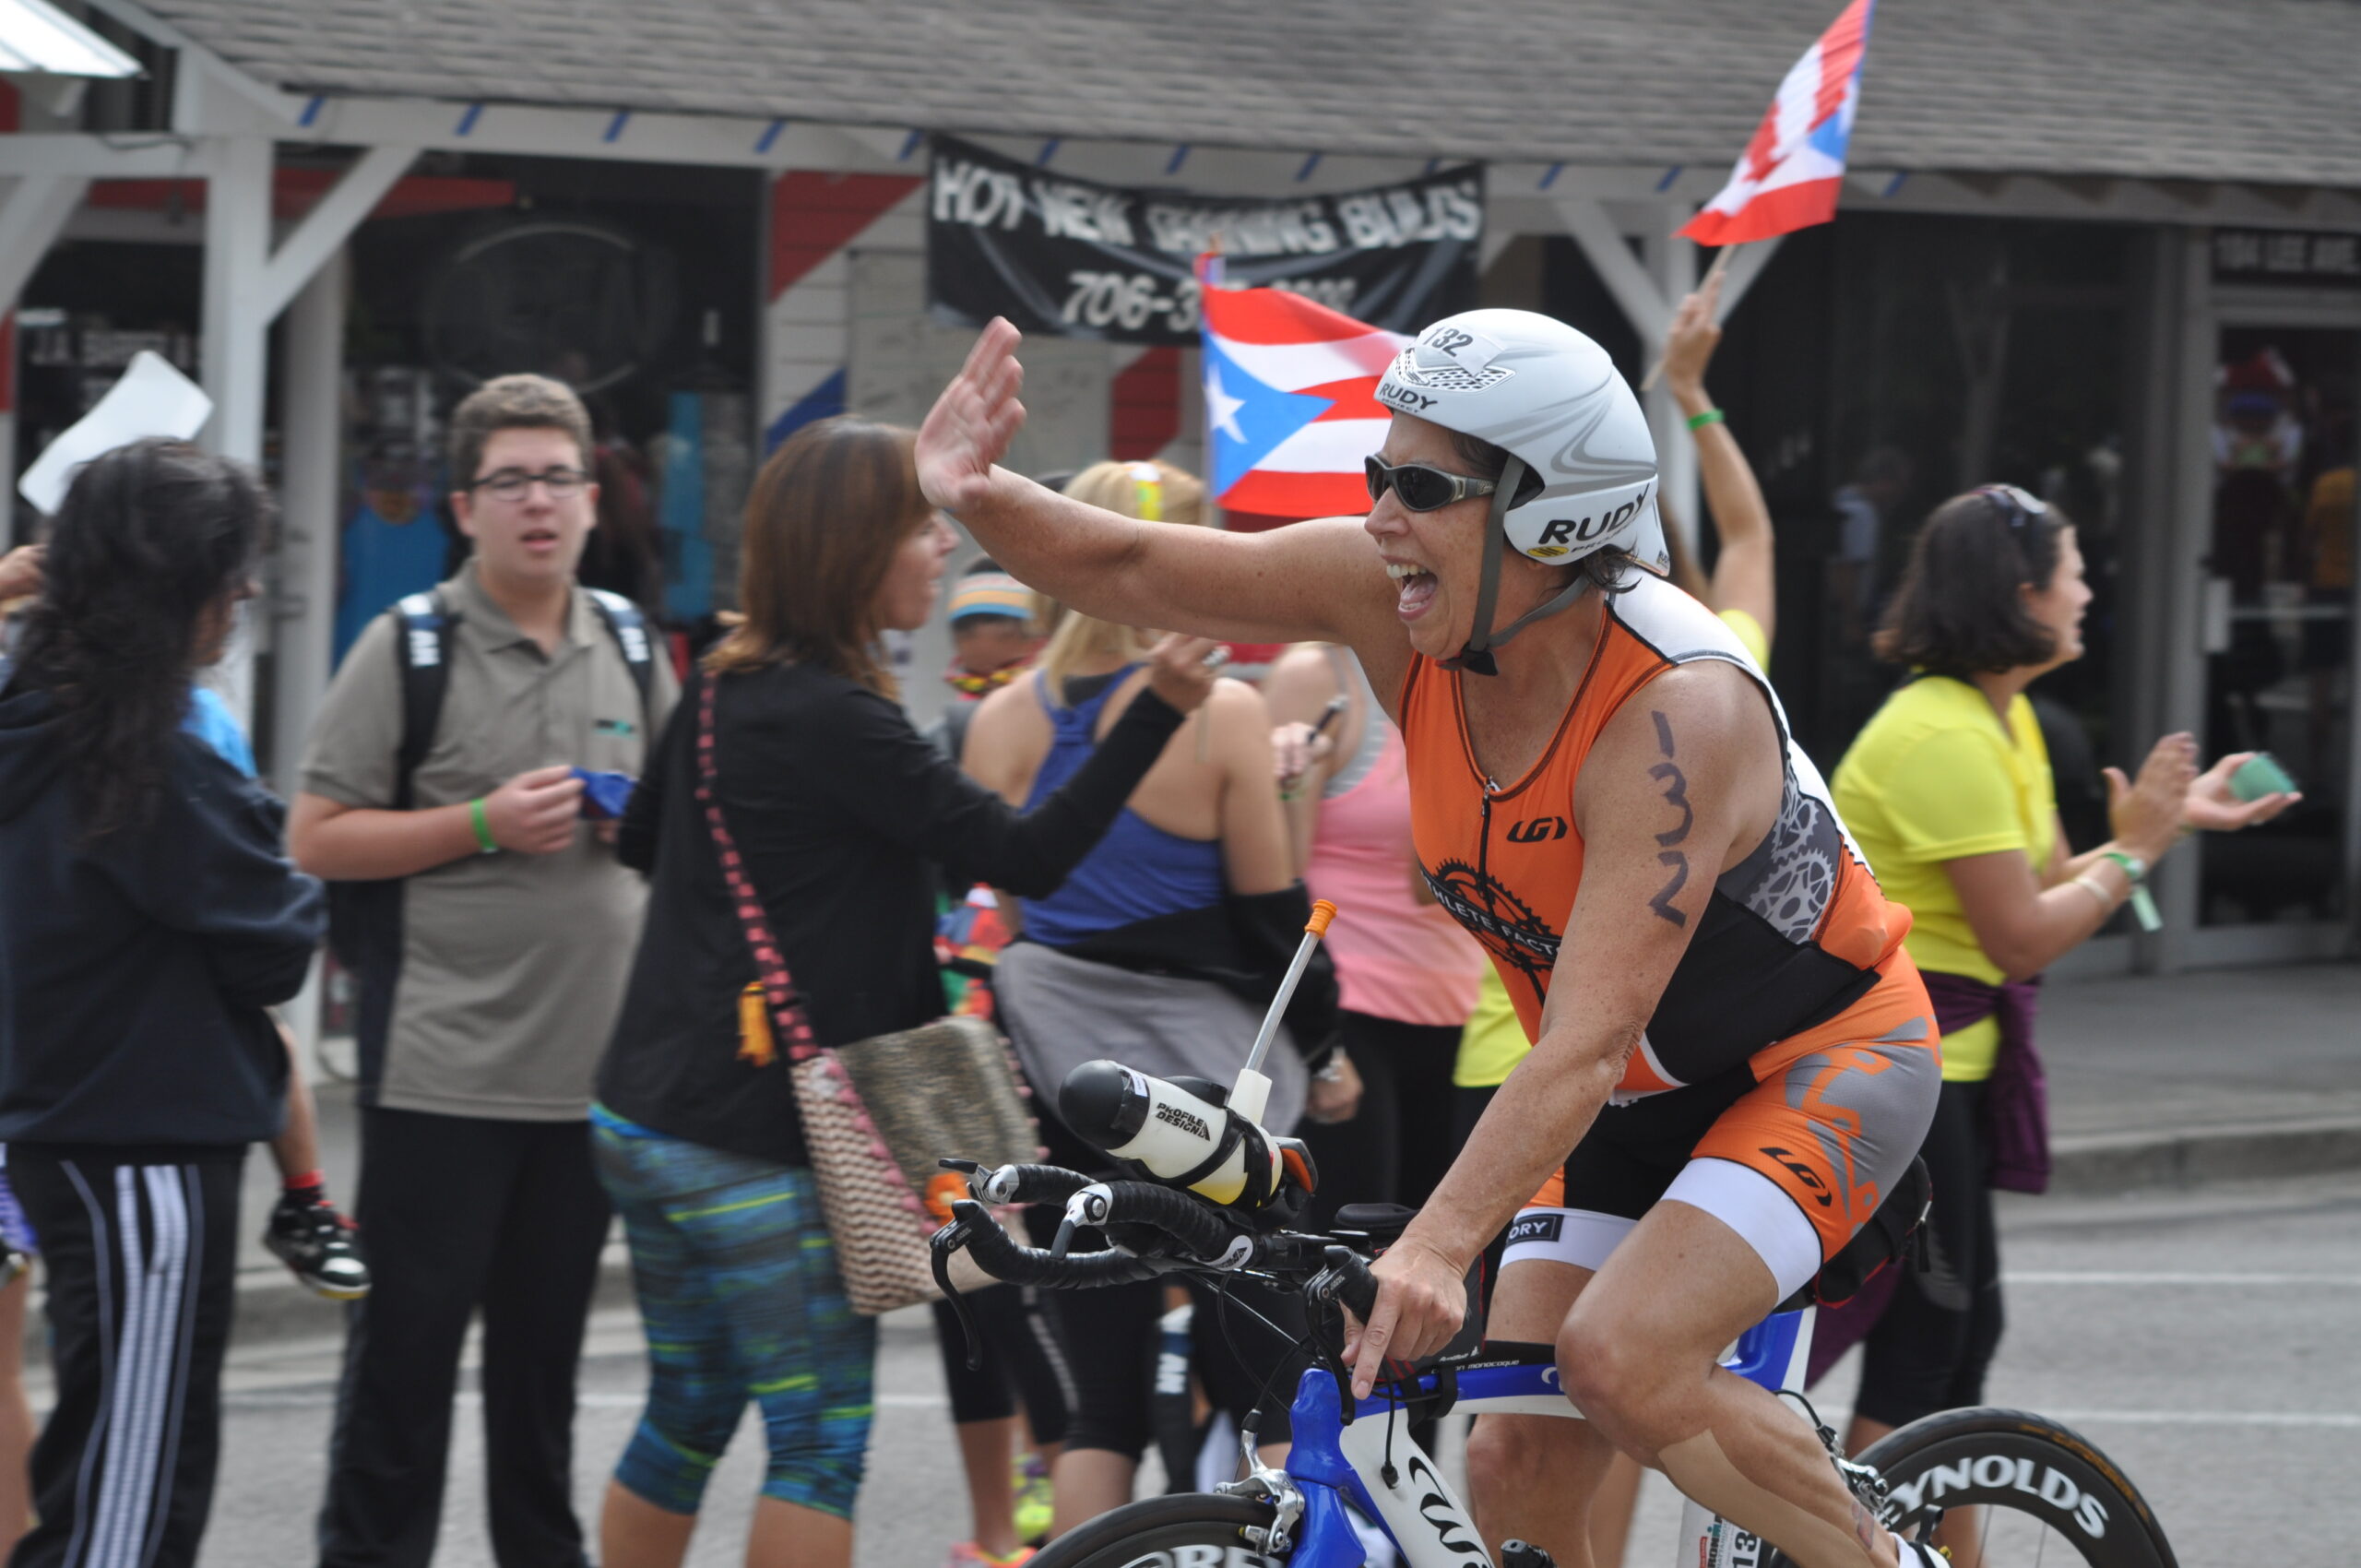
Field Visit
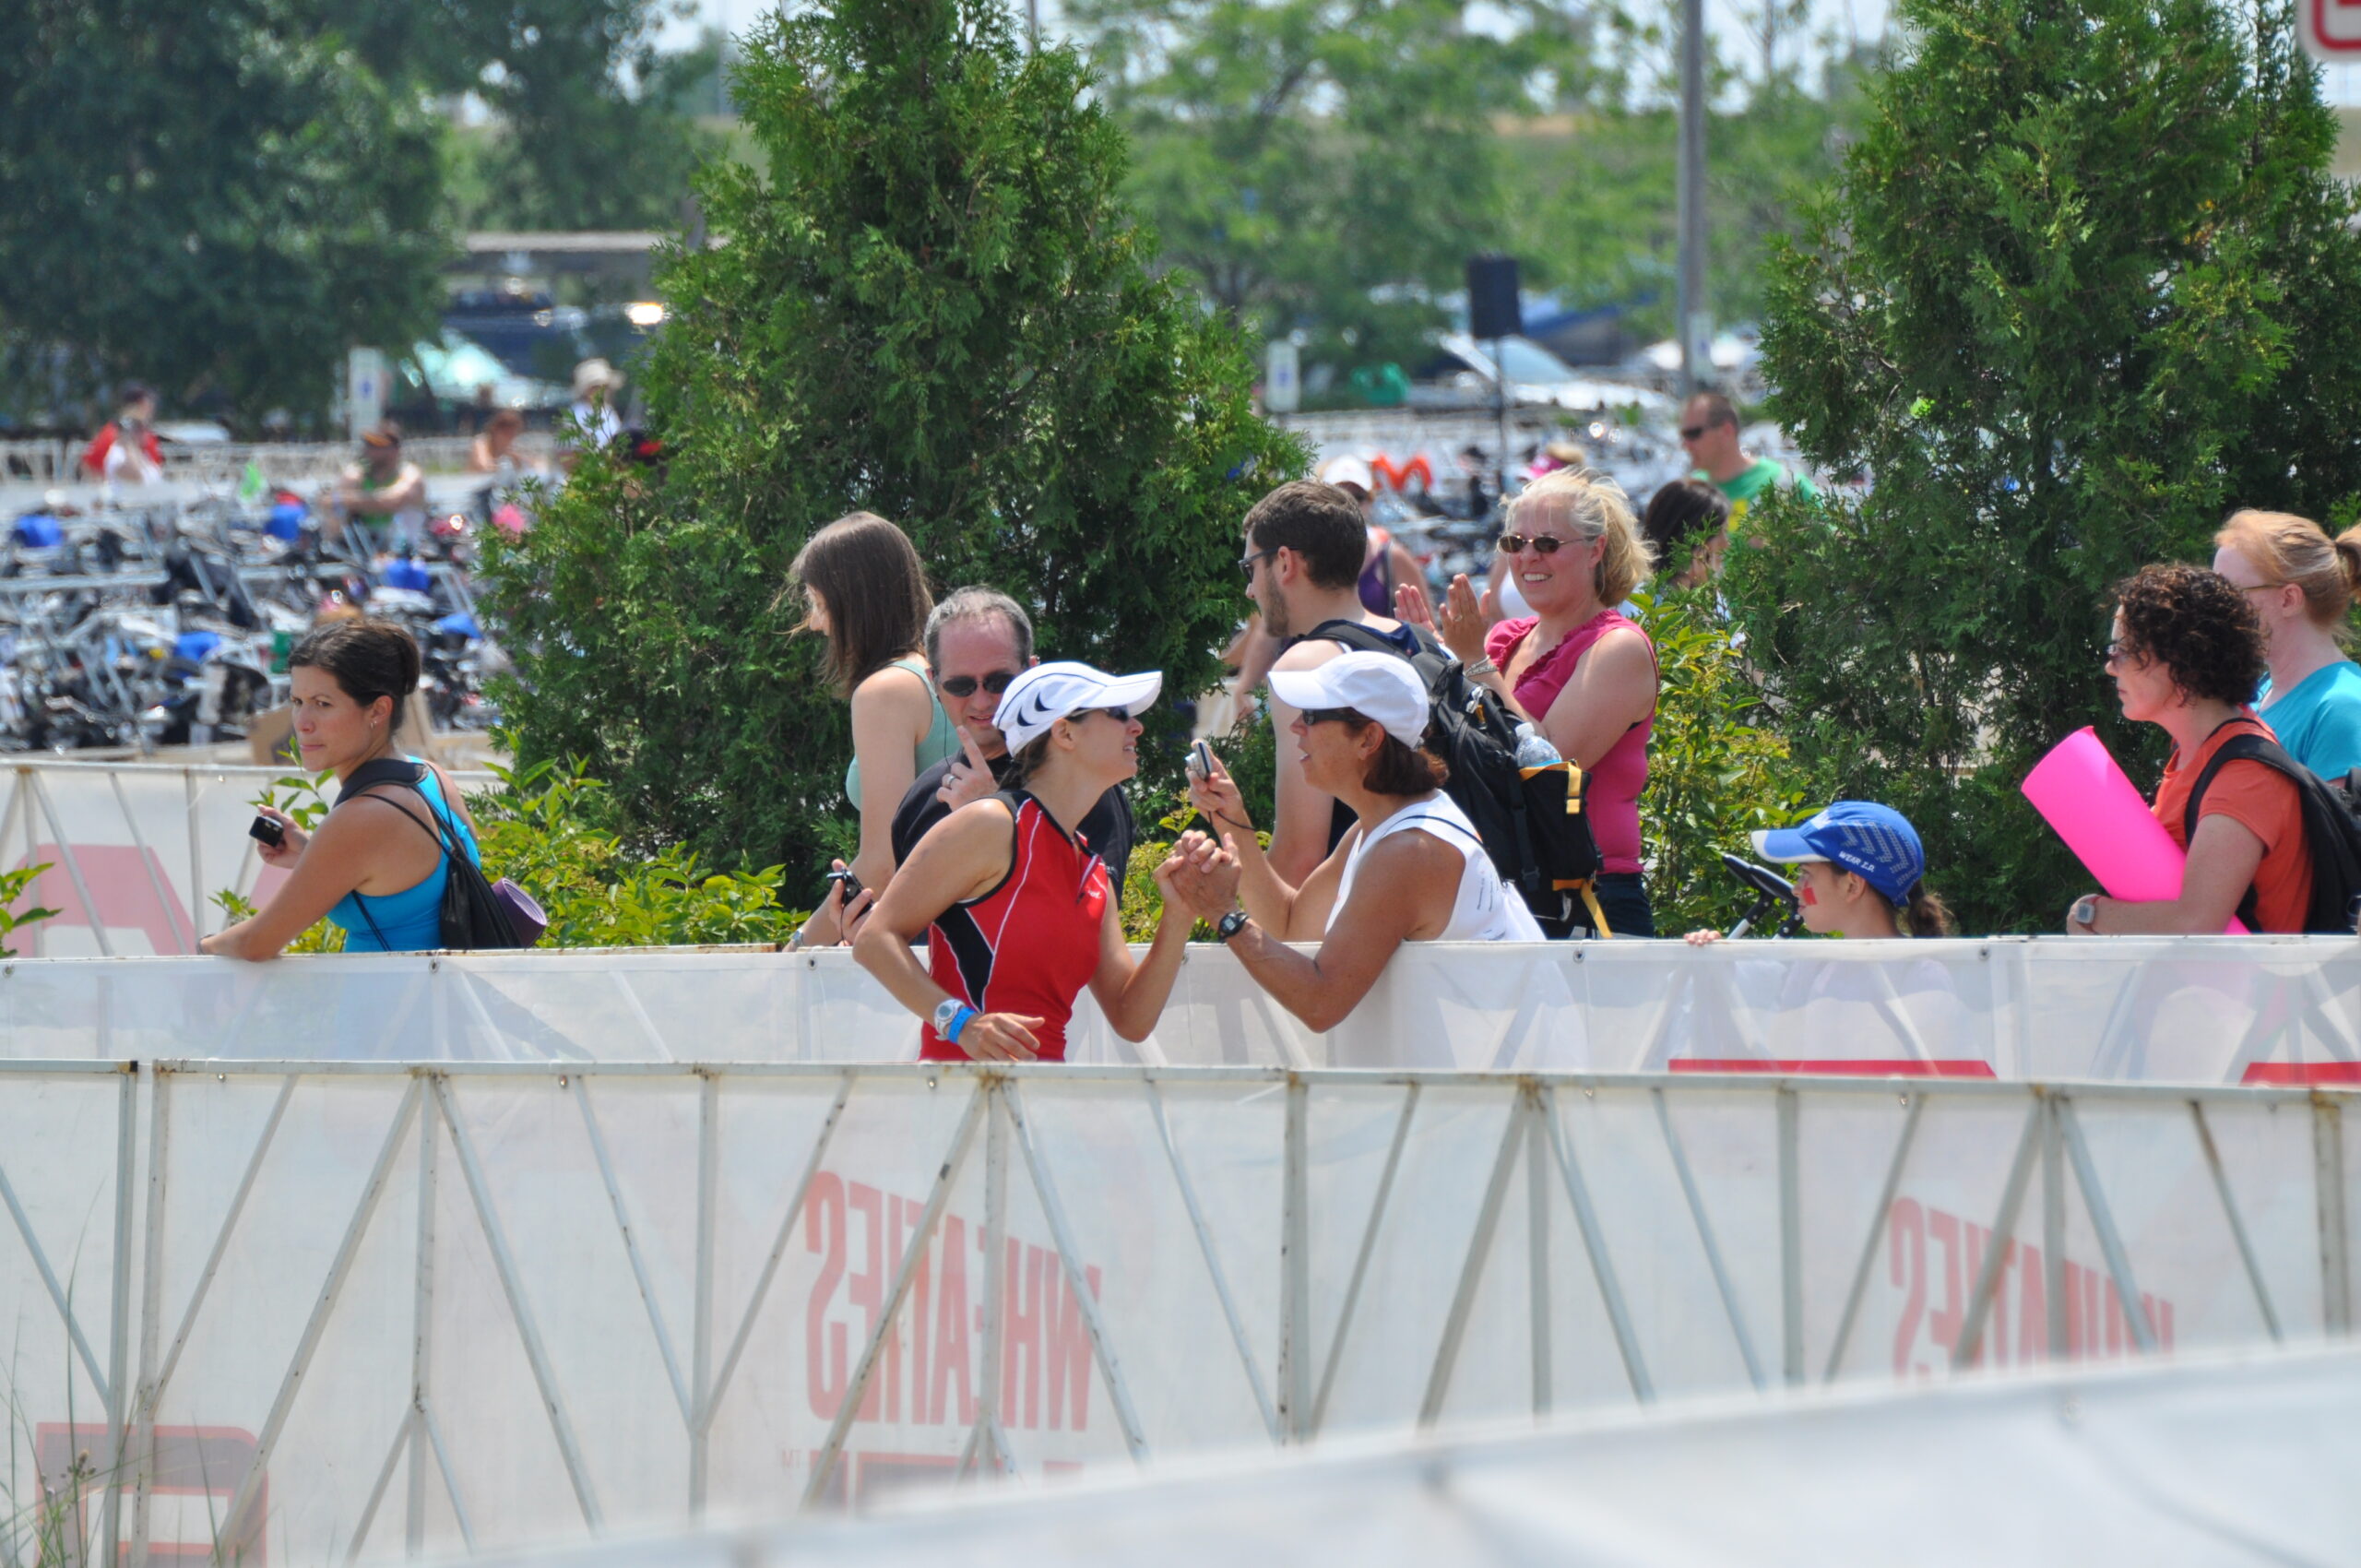
To best understand the journey first-hand of a spectator in an unknown city, I documented the day and conducted short informal interviews.
Outcome: Direct insights into pain points concerning planning, communication, and sharing the experience with others. Built knowledge base for concepting and addressing user experience with the proposed application.
Exploratory Interviews
These interviews focused on exploring both target audiences (elite to age-group athletes; experienced to inexperienced spectators) and personal accounts navigating pre-race, onsite, and post-race logistics. Questions covered communication and logistics leading up to an endurance race, during the race, and then post-race. Technology adoption concerning apps used in their daily lives as well as how they plan travel logistics.
Outcome: Knowledge gained from personal experiences surrounding pain points of planning, communication, and sharing information with a group. Confirmation of technology tools use, and app familiarity.
Validation Surveys
Individual surveys tailored to the target audiences asked questions aimed to substantiate the process, pain points, and tools used to plan and spectate an endurance race.
Outcome: Key insights revealed the types of applications each group used and why. It also gauged interest in potential features being considered for the proposed application.
Affinity Diagrams
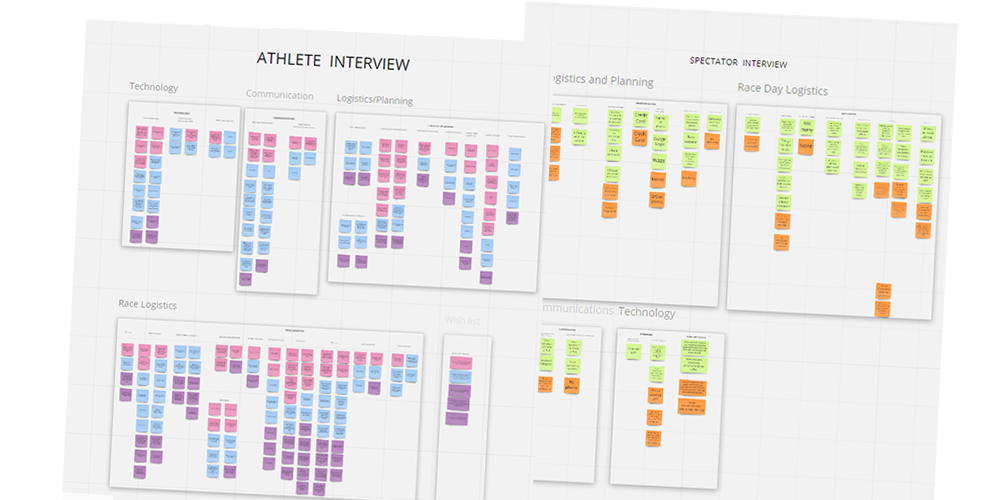
- Research Data from field visit, exploratory interviews, and validation surveys revealed patterns supporting the need for a mobile application.
- Key Needs: Improve and streamline the logistics, communication, and navigation for athletes and spectators.
- Proposed features were developed based on research insights.
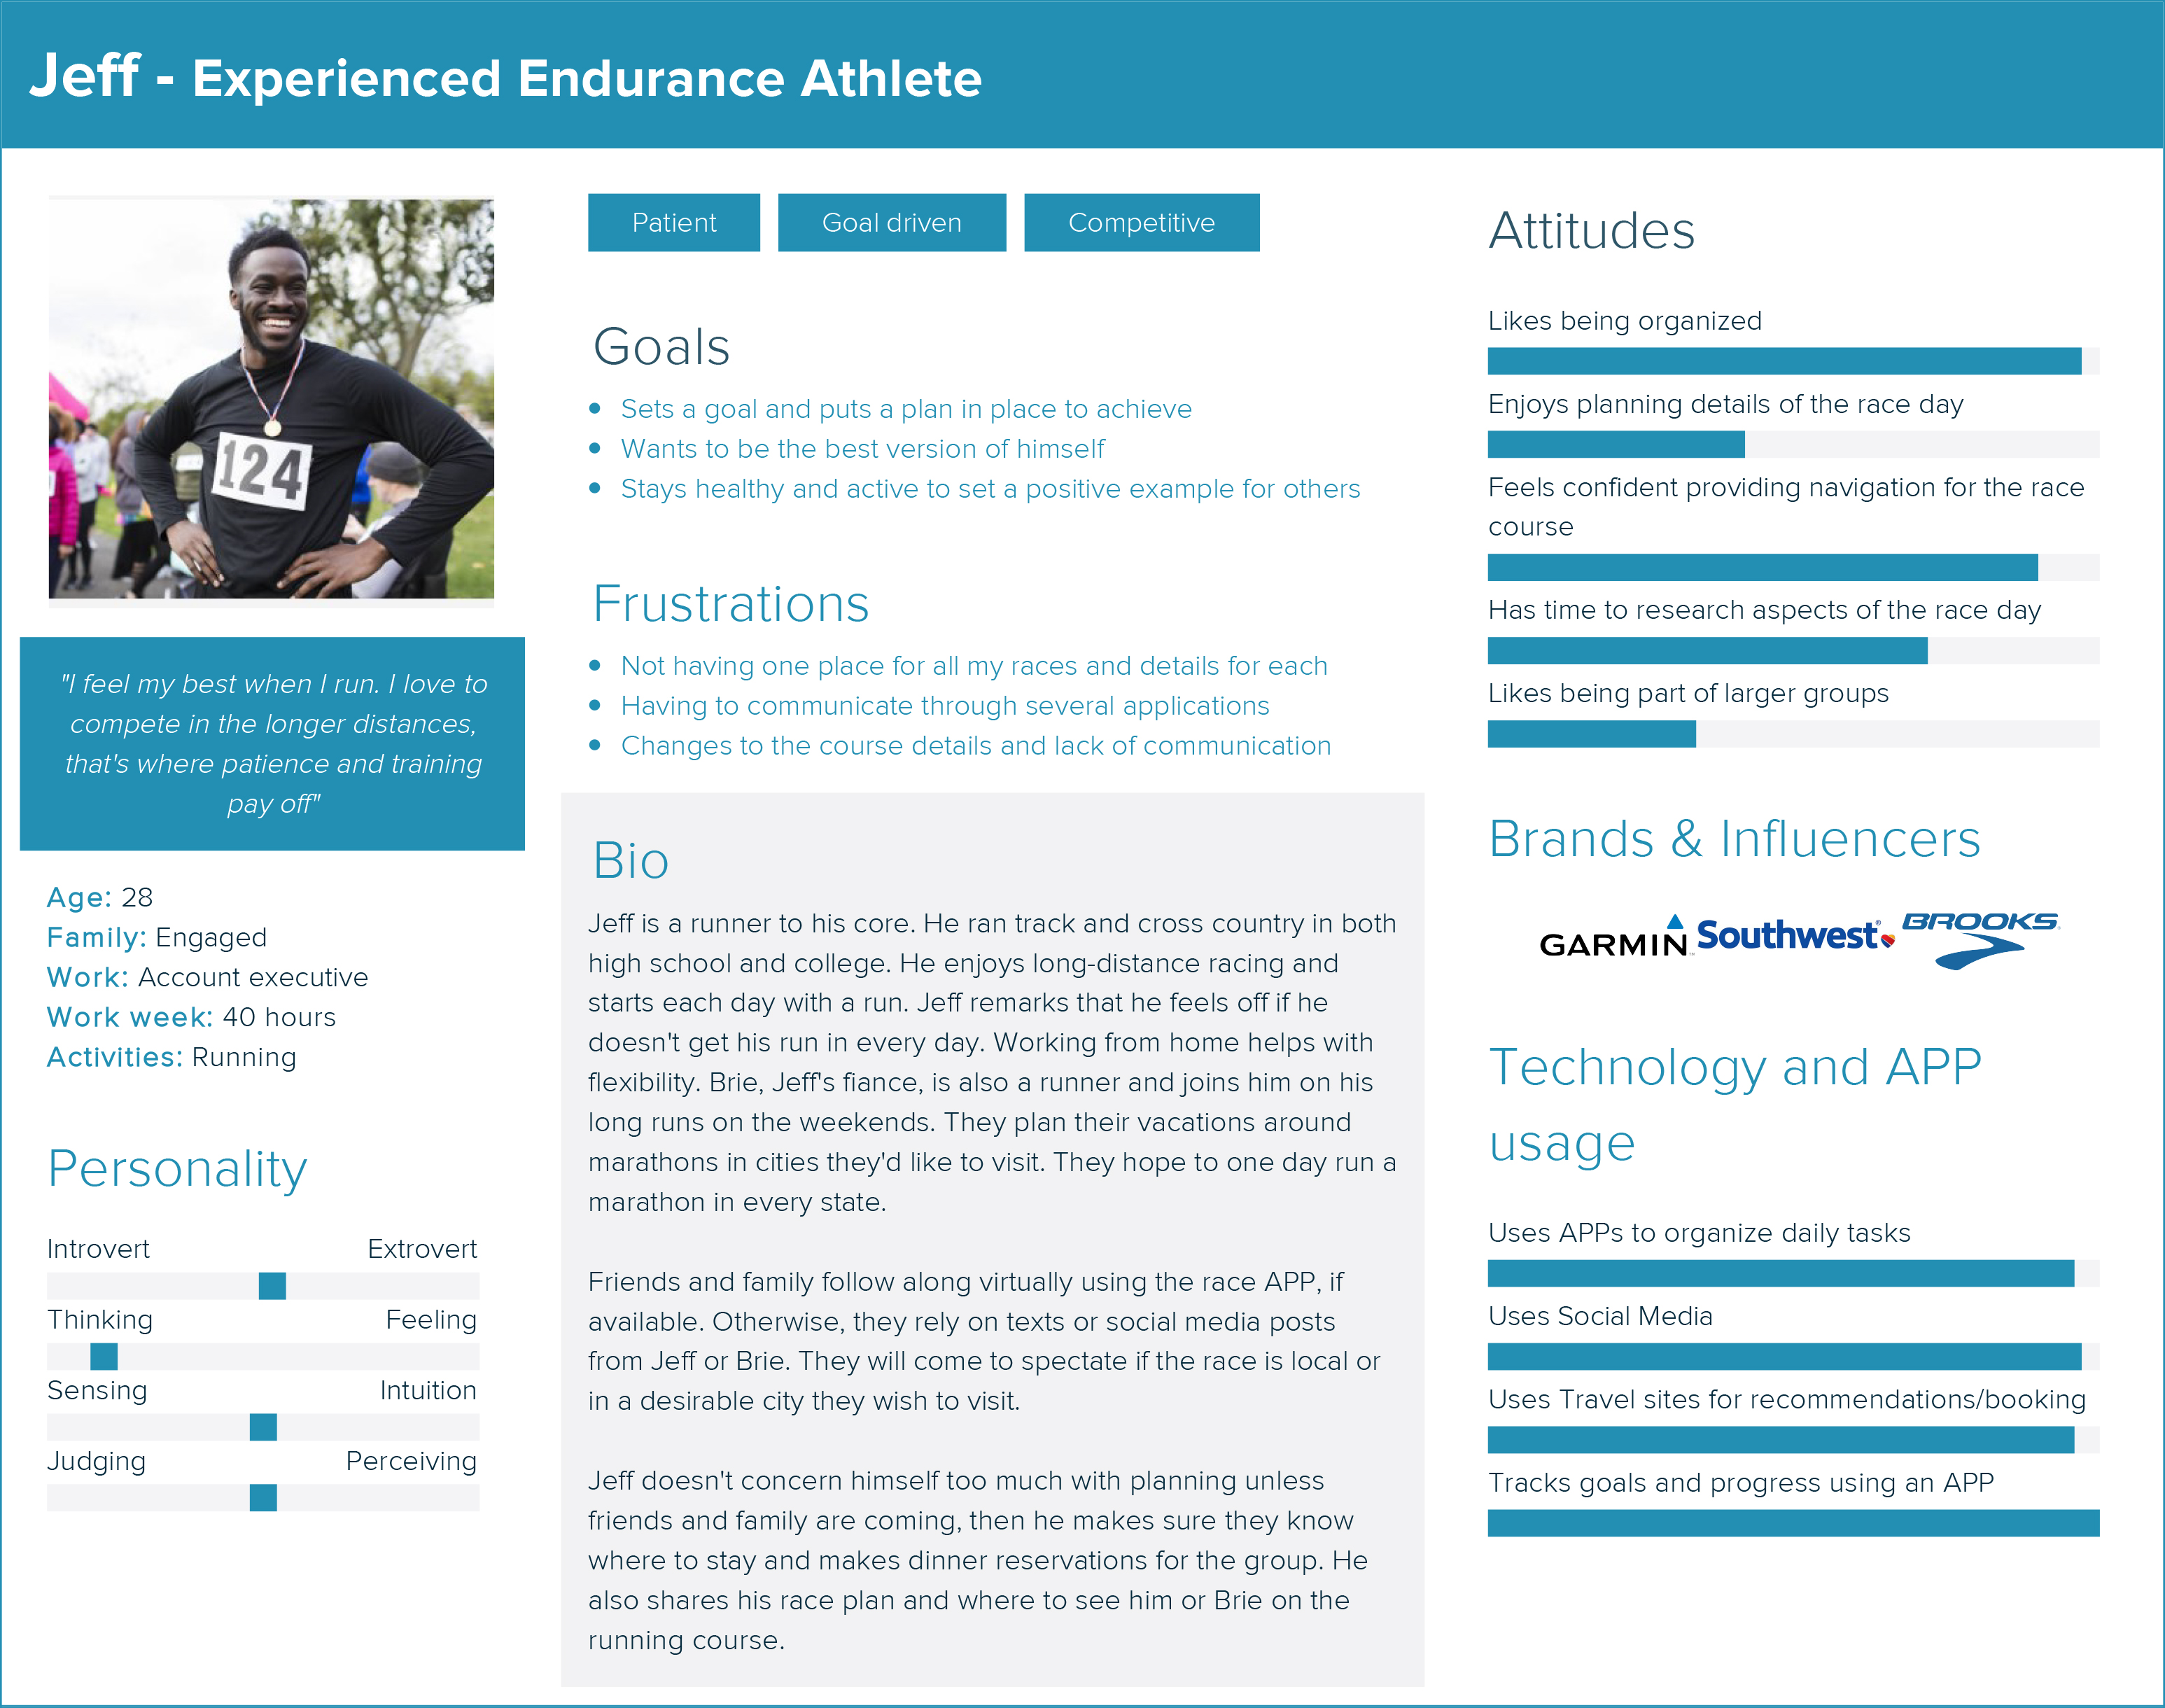
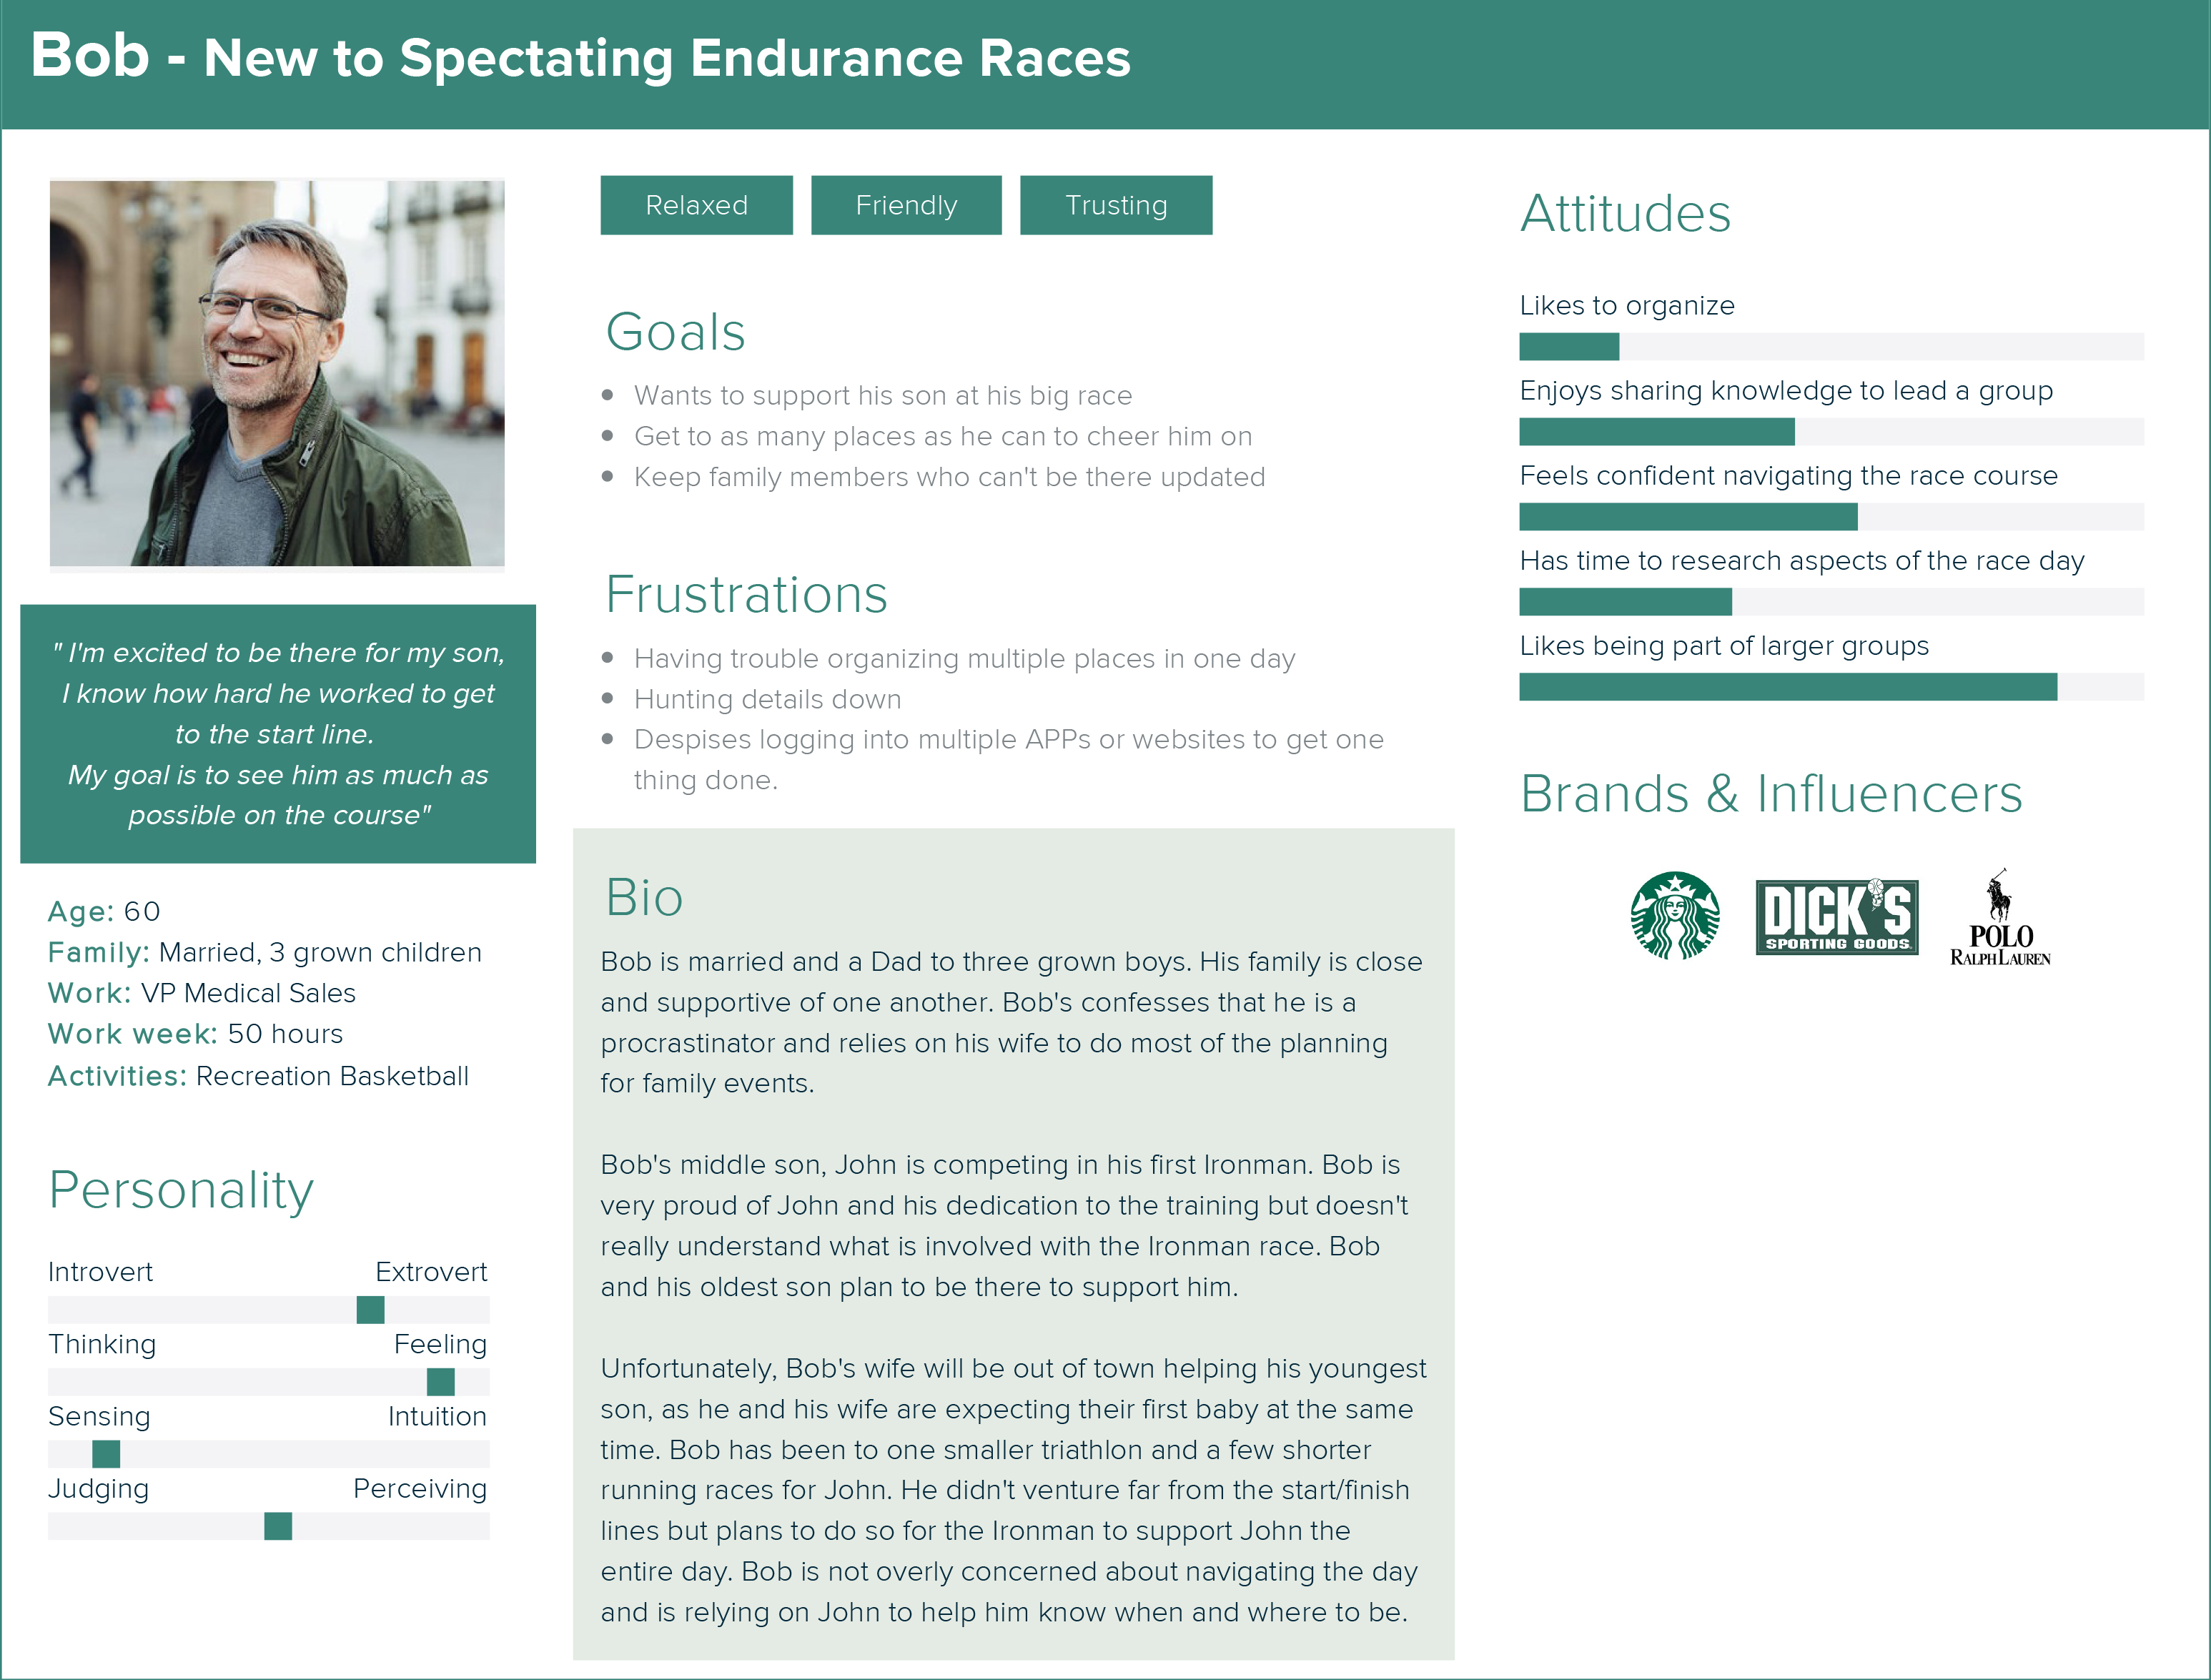
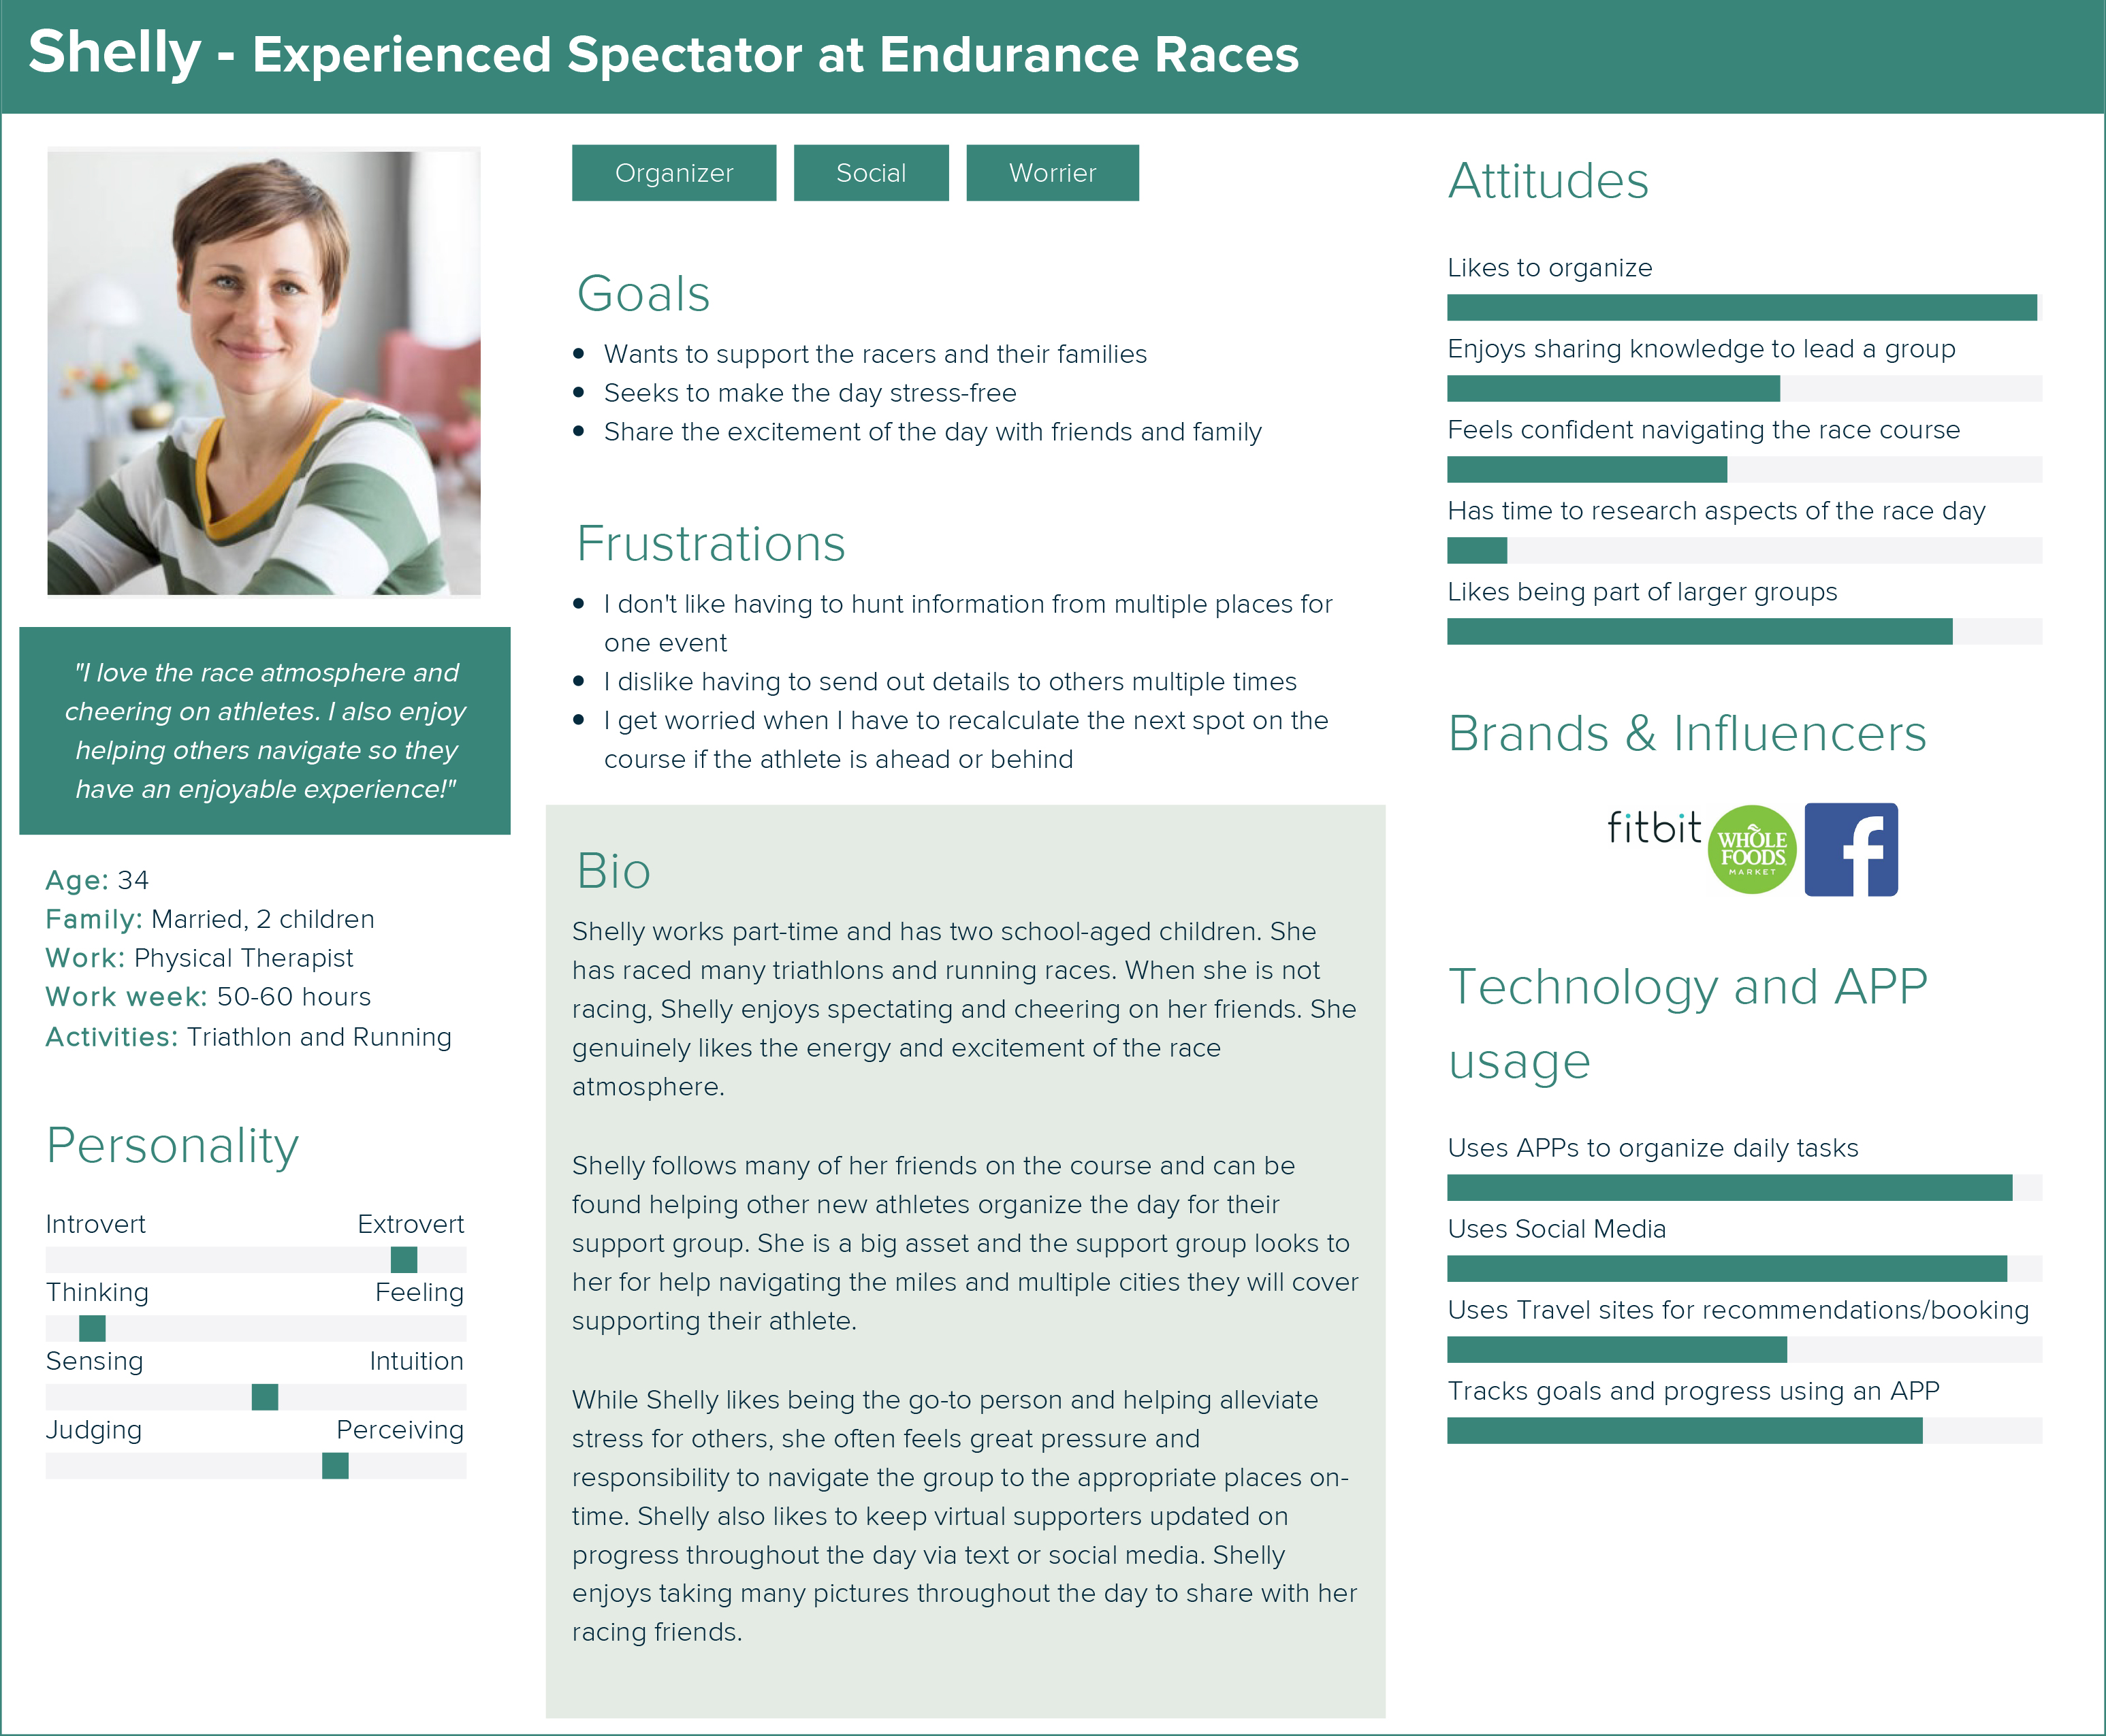
Personas
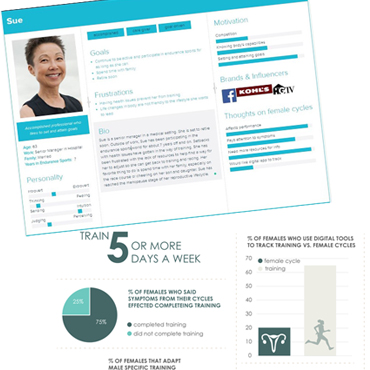
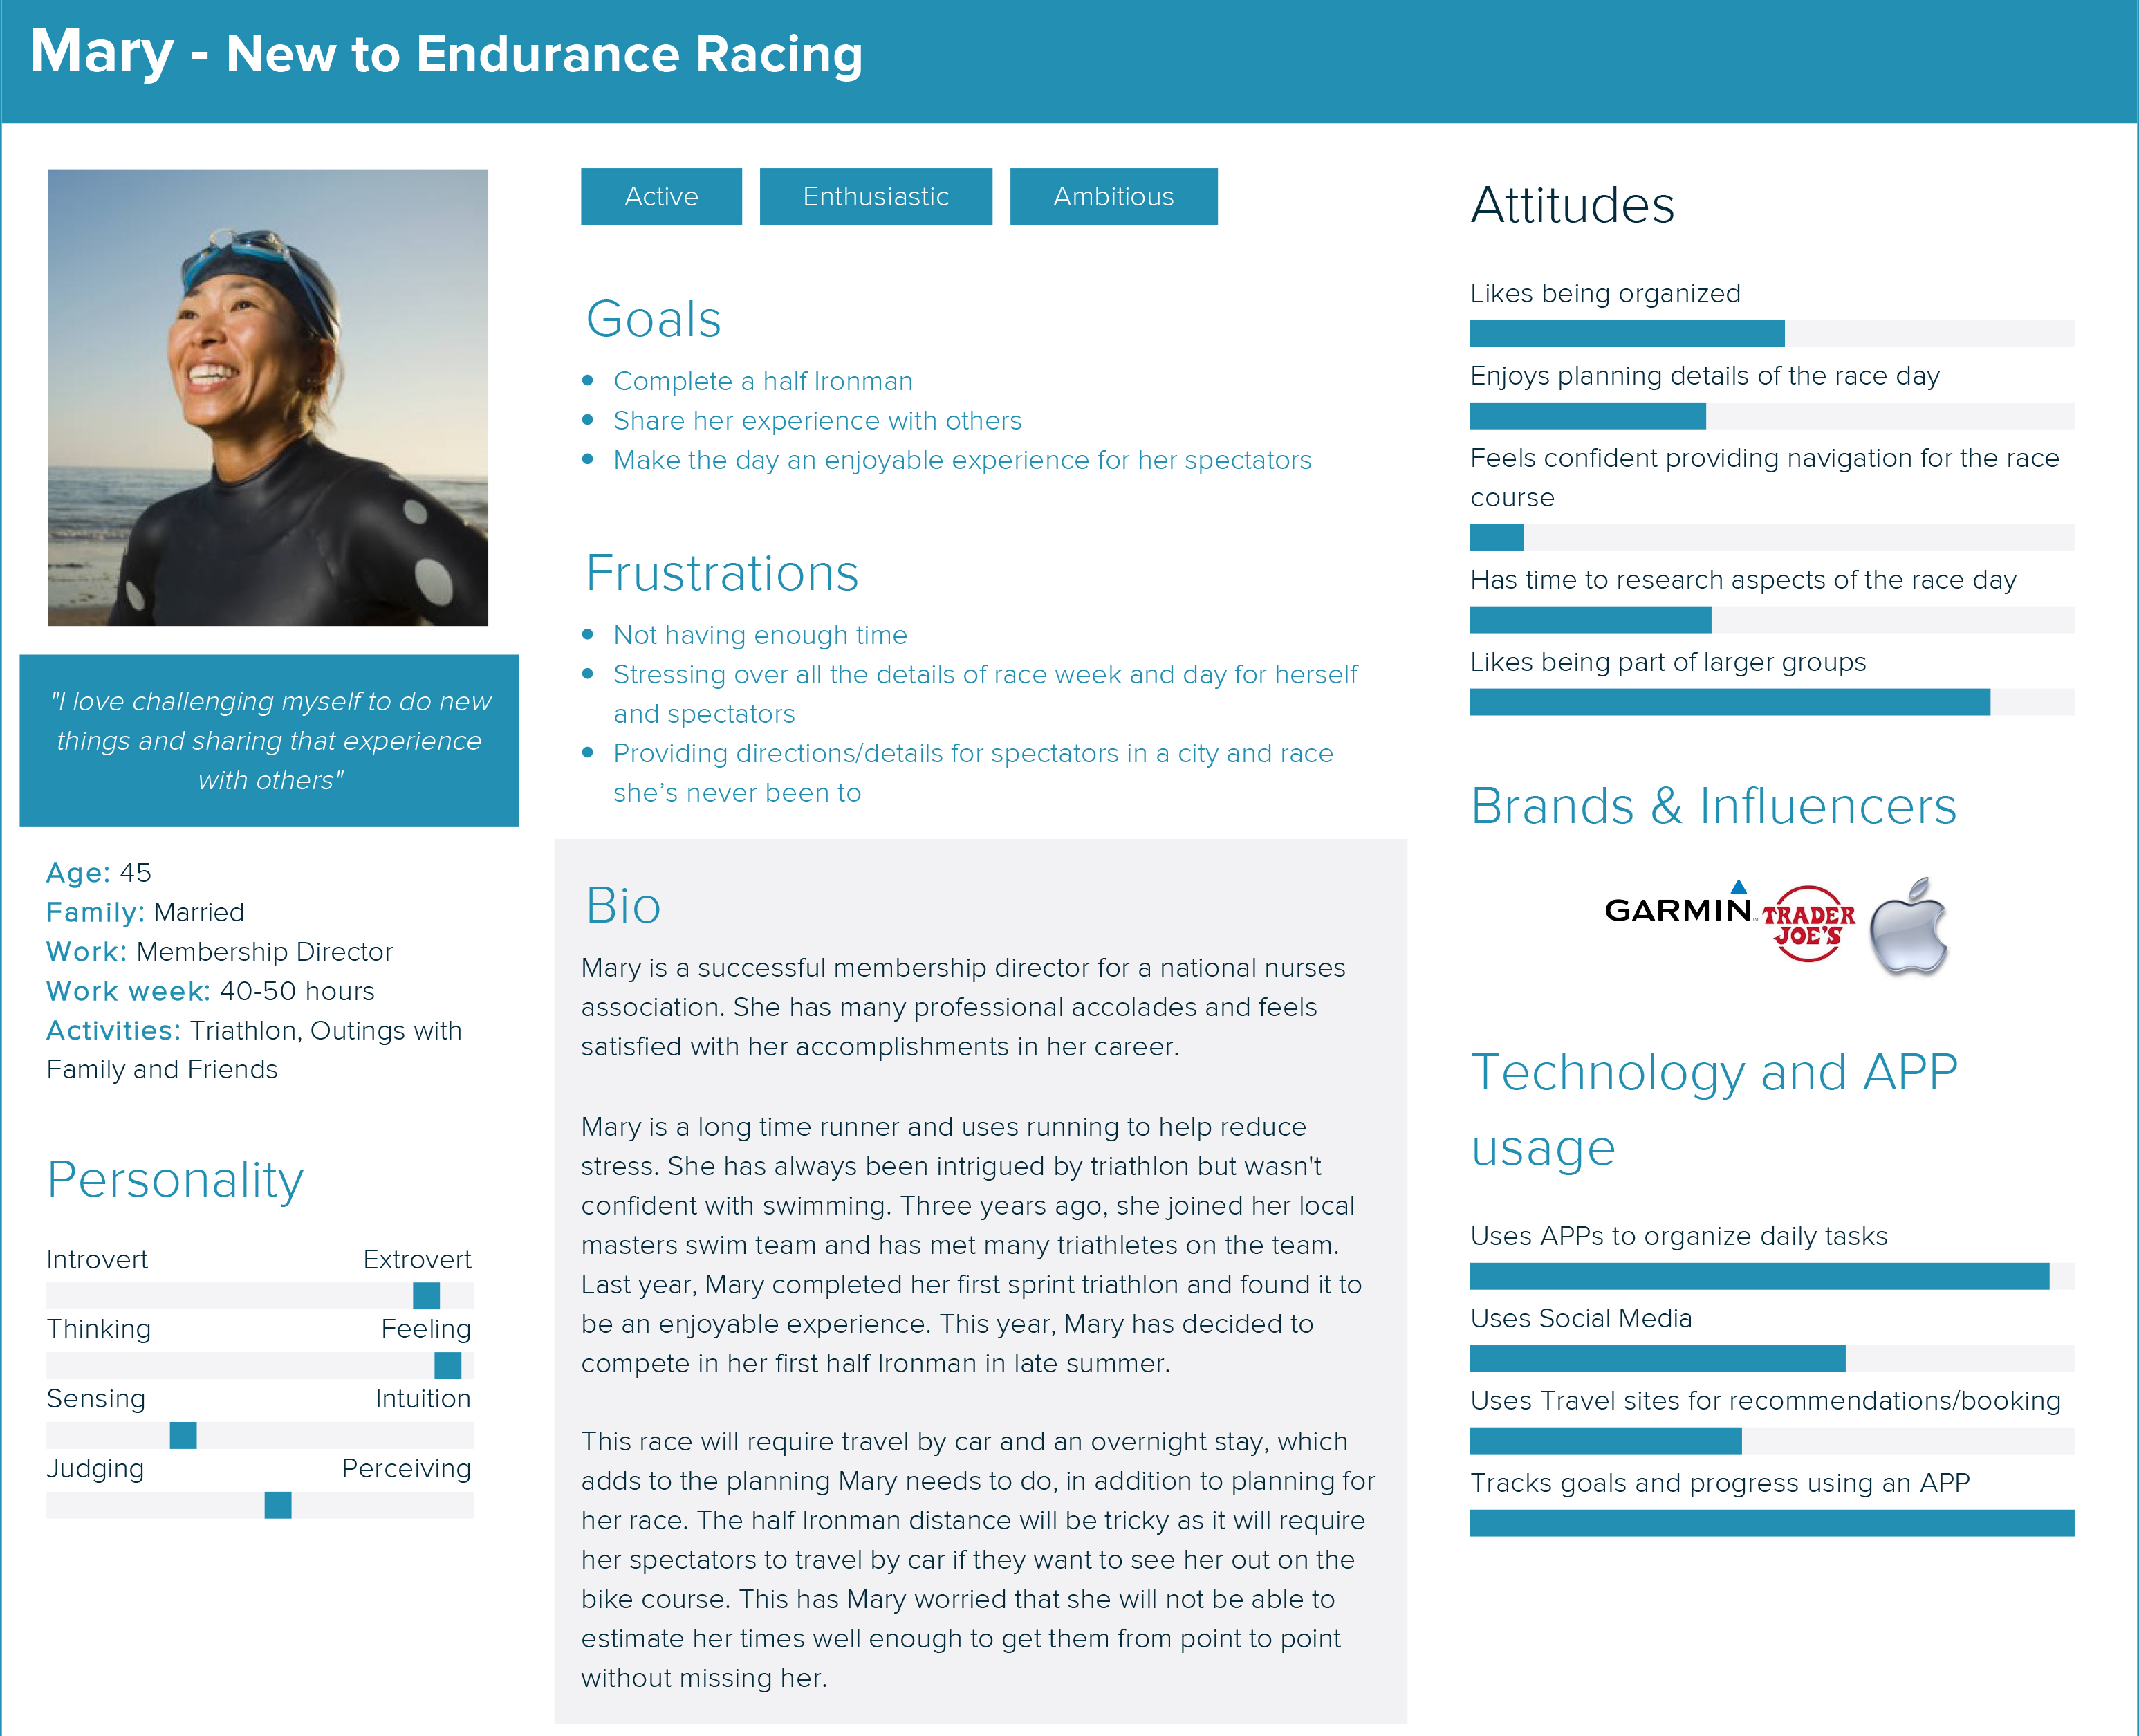
- Four comprehensive user personas were created through extensive research and data analysis.
- Each persona outlined the user, their attitudes, goals, frustrations, personality, technology, application usage, brand influencers.
- User scenarios were developed to illustrate their approach leading up to, during, and after racing or spectating.
- Both personas and user scenarios informed and led the foundation and direction of product and features.
Journey Maps
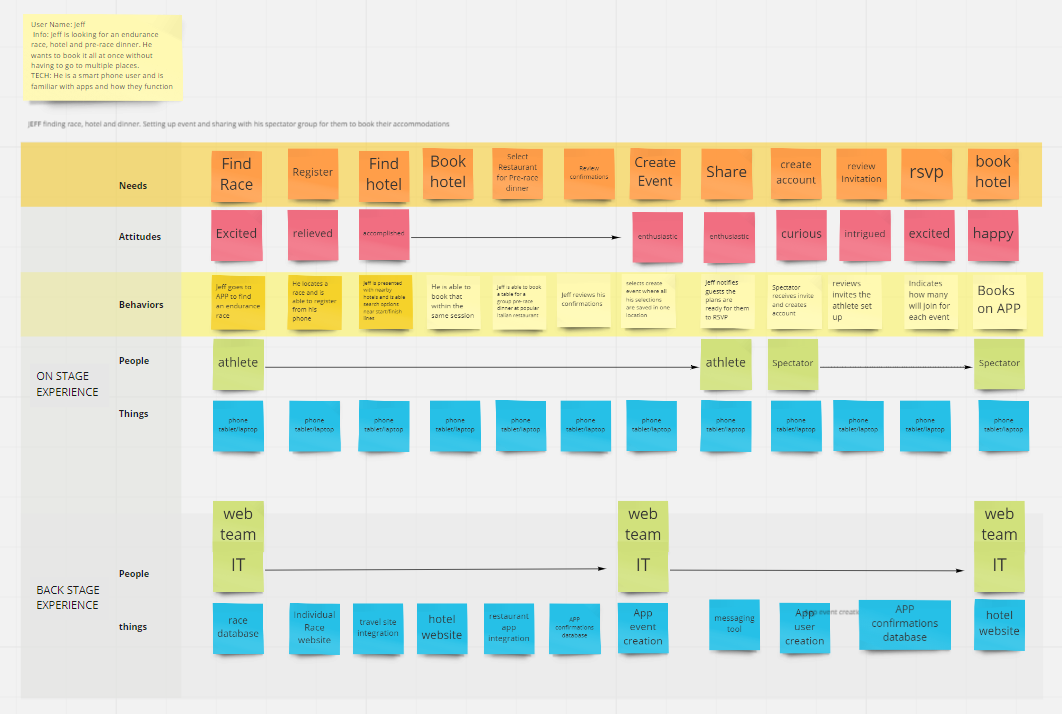
Created to capture the process for each persona's experience as they completed defined tasks, functions happening behind the scenes as well as the devices used and who was using them.
User Flow for defined tasks
- The top 3 features and functions were identified.
- Task flows with interface prototypes were created illustrating the steps of the user's experience when trying to complete the task given.
Task 1: Planning, Logistic Integration
- Athlete Task - Register for a race, select/book a hotel, create an event.
- Spectator Task - Accept event invitation, RSVP/book recommended accommodations.
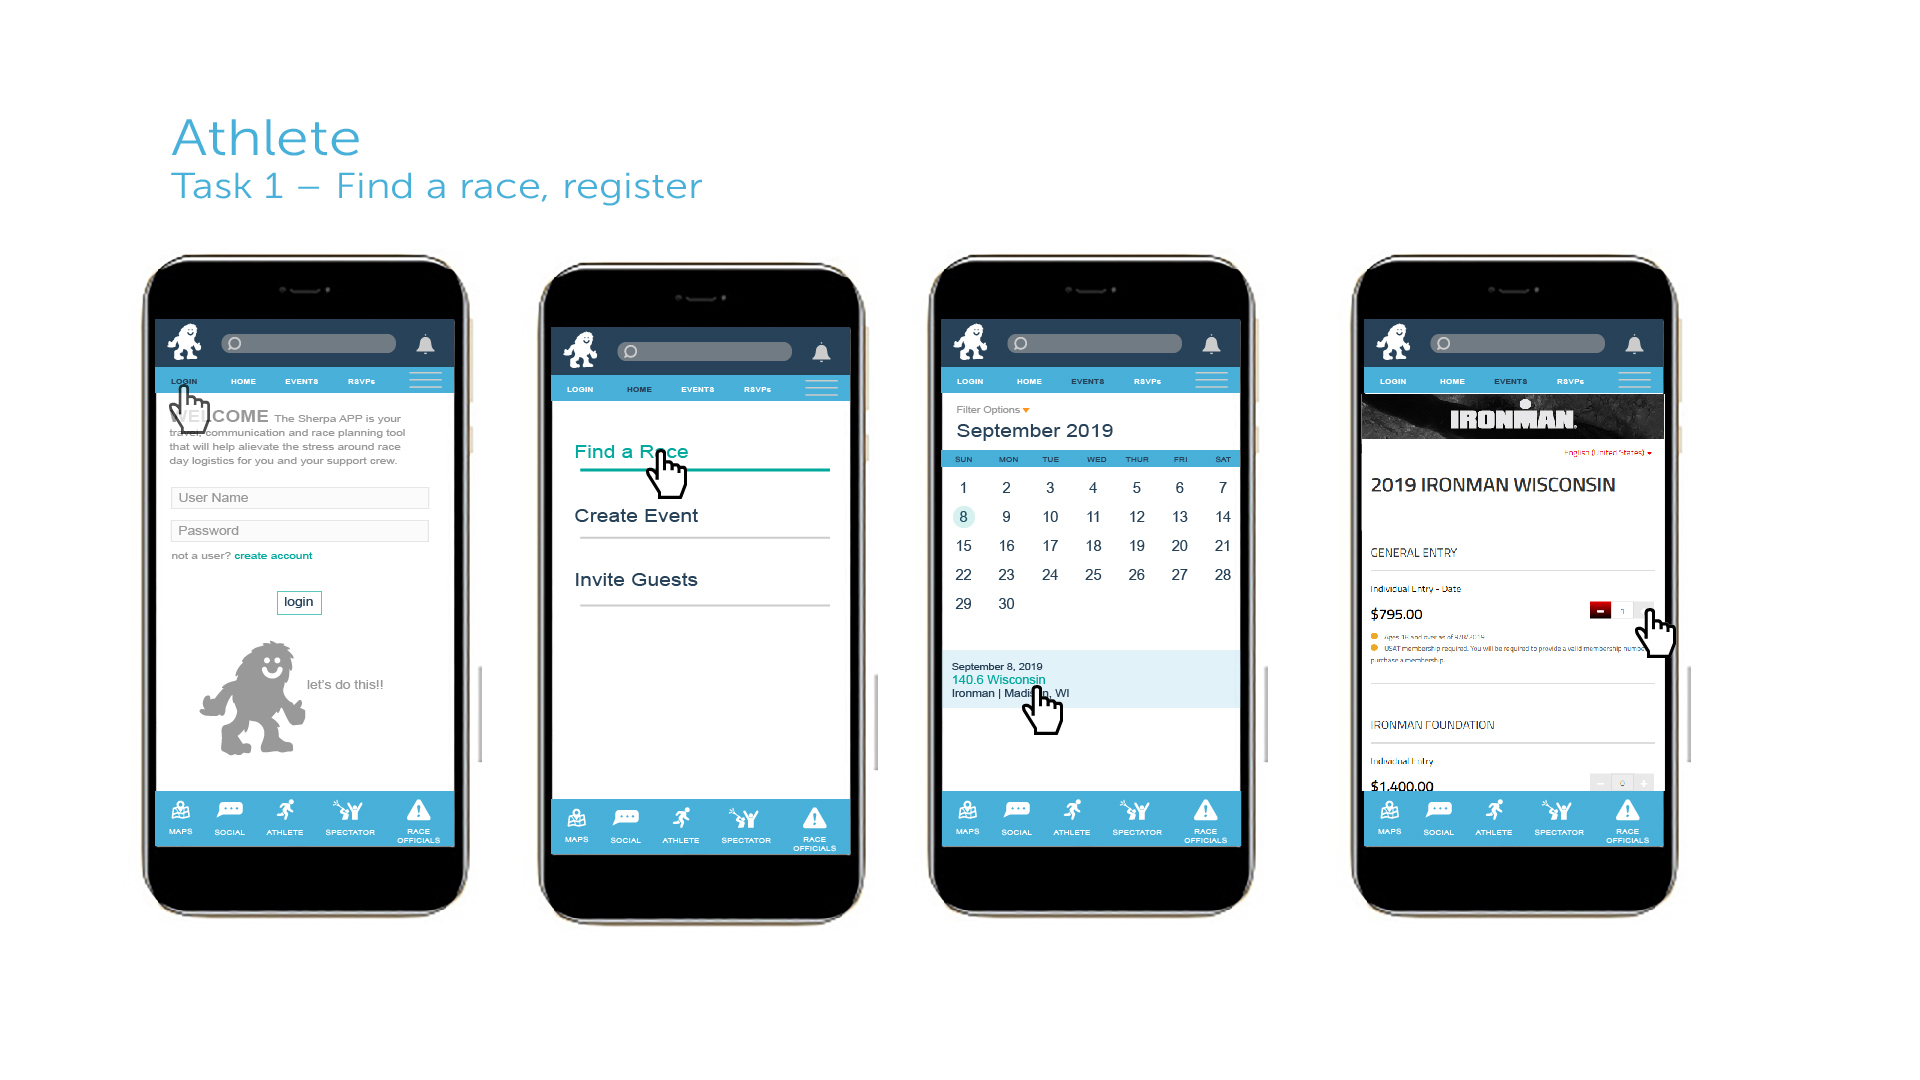
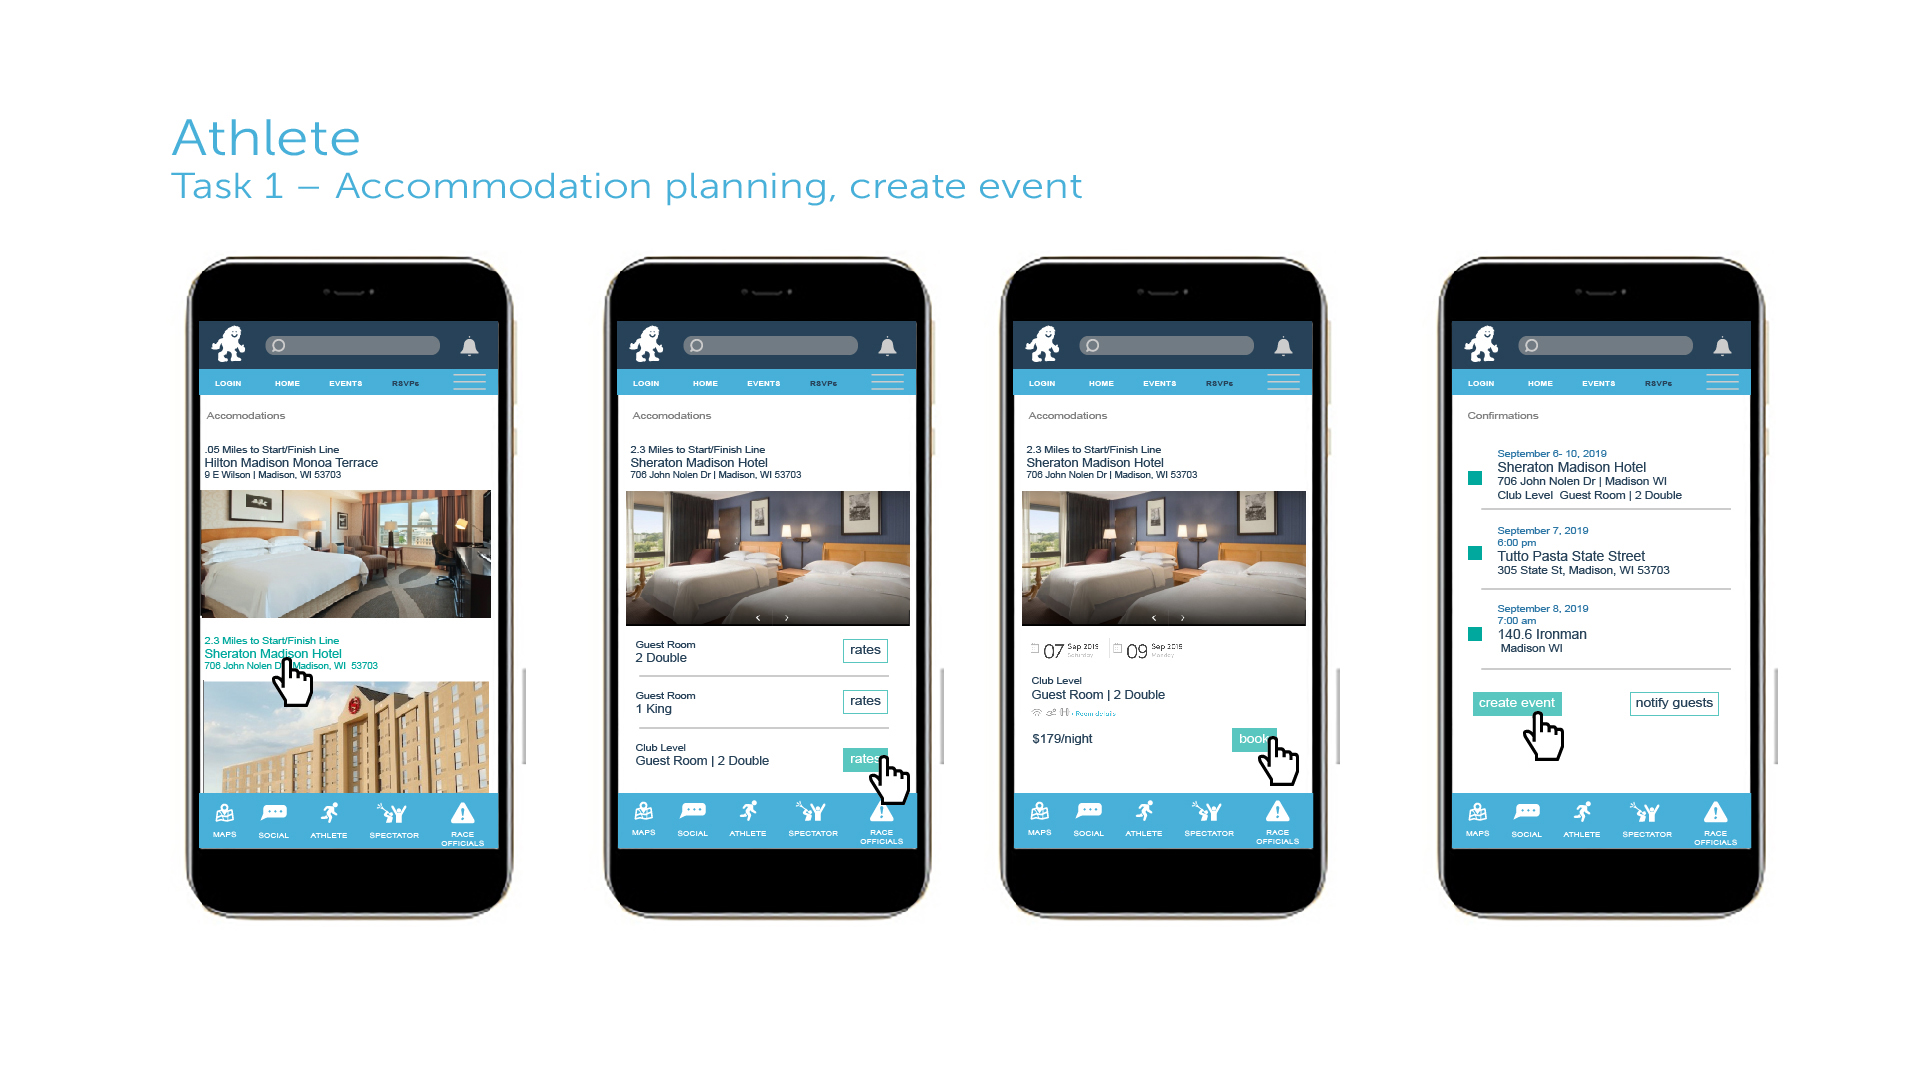
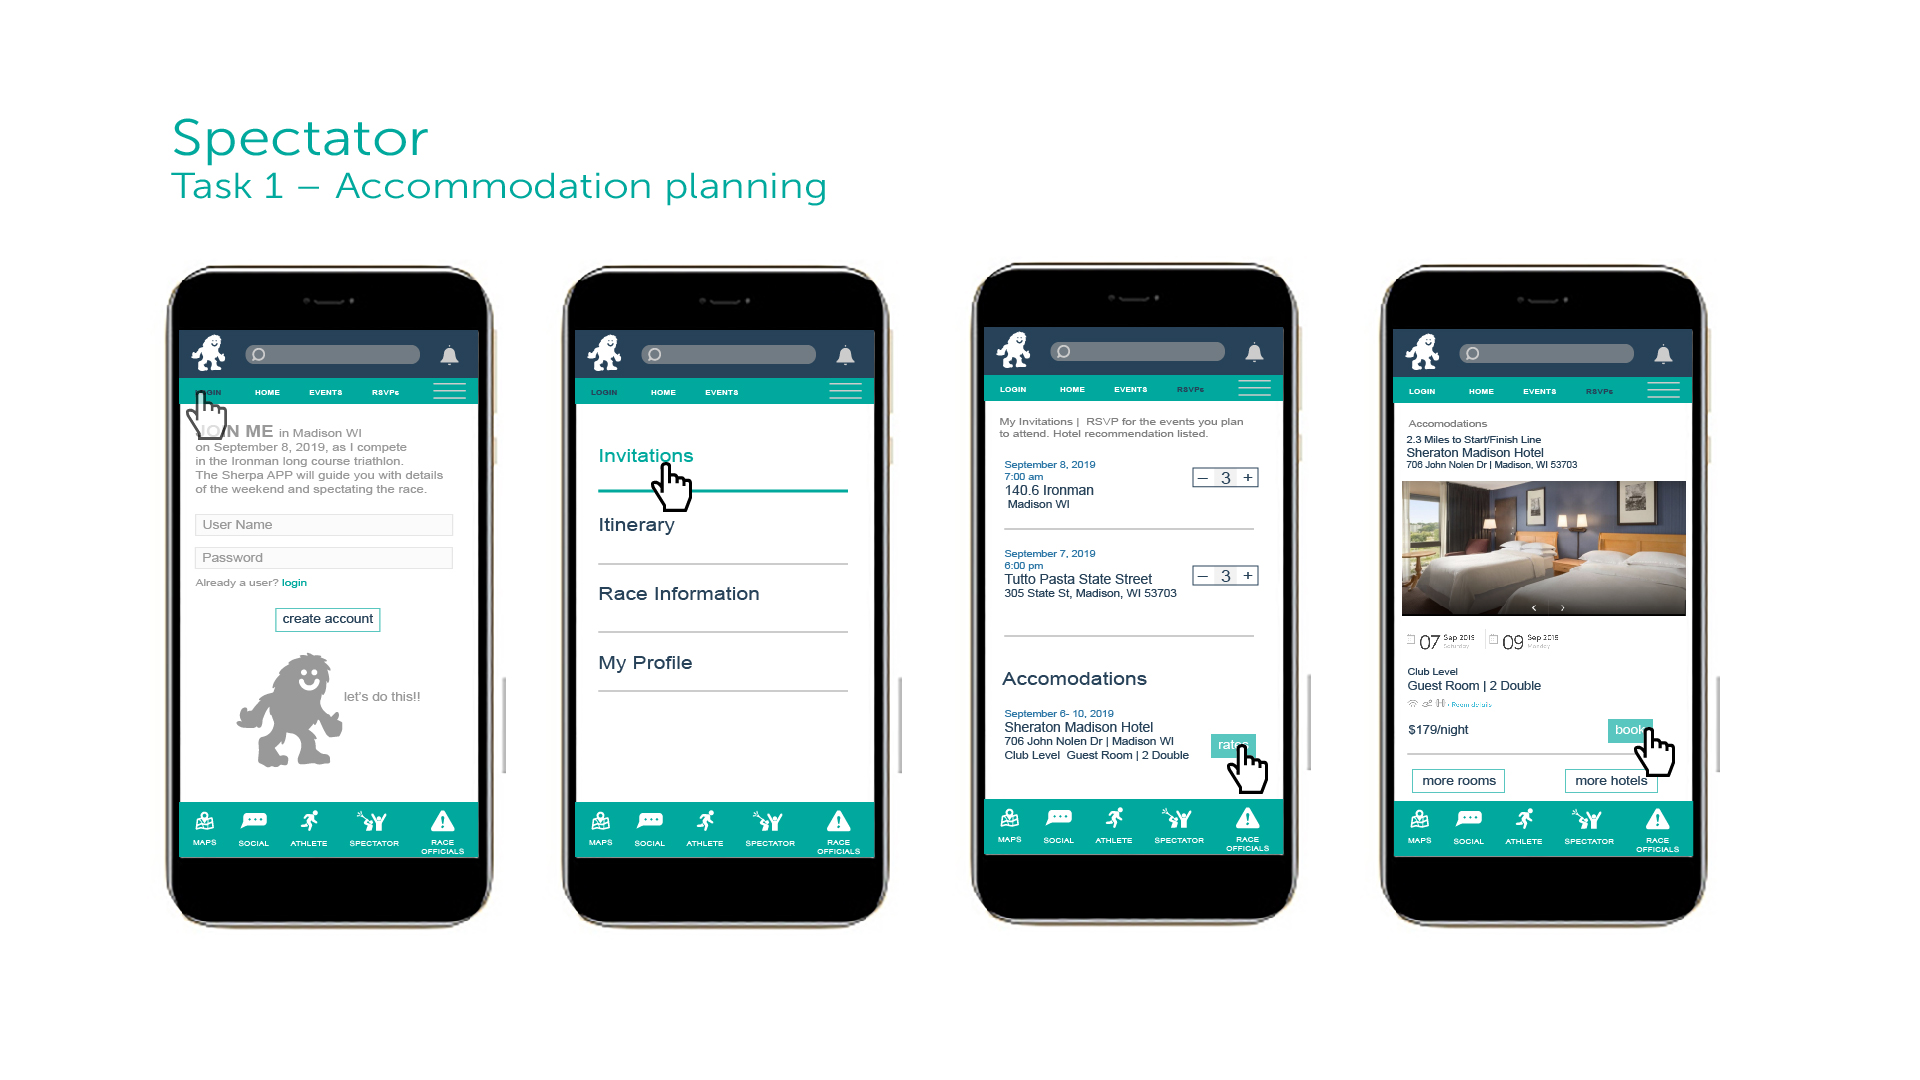
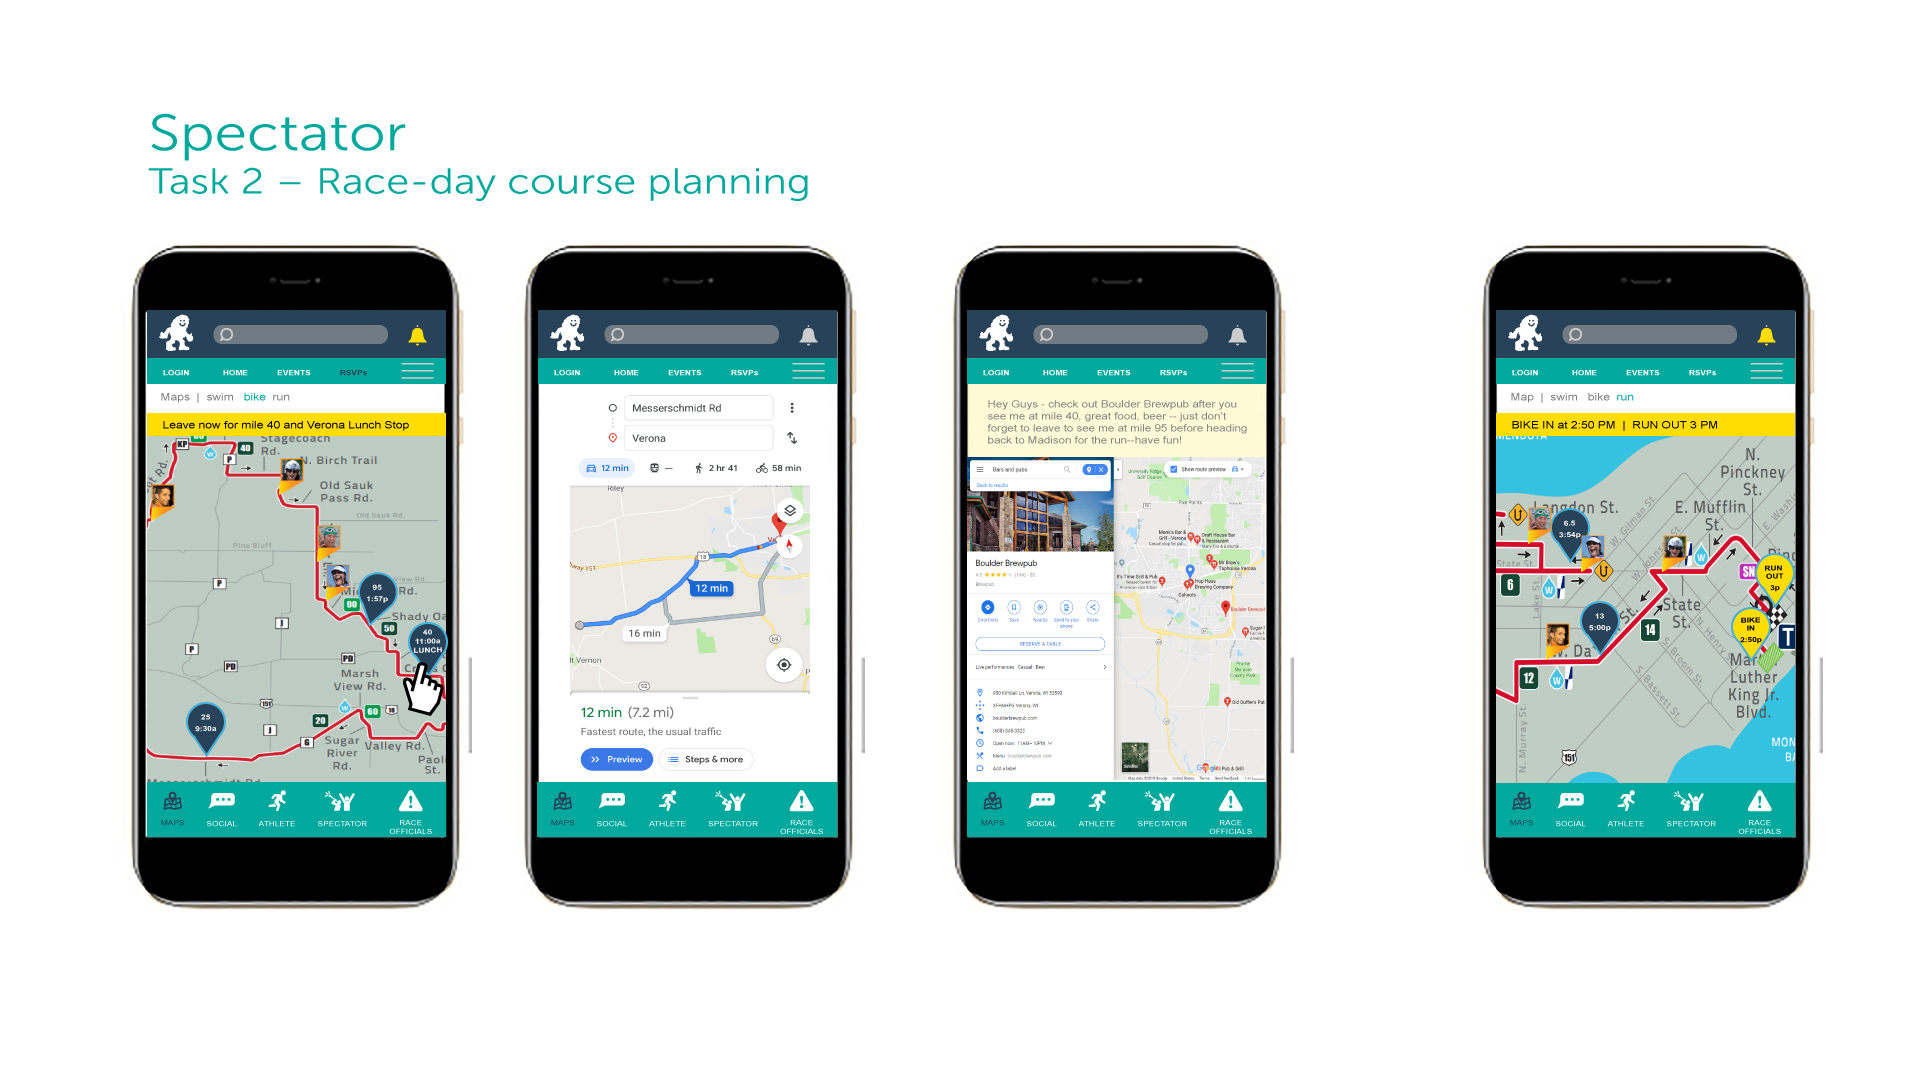
Task 2: Race-day Communication, Navigation Logistics
- Athlete Task - Construct Pace Plan.
- Spectator Task - Receive and use the Pace Plan.
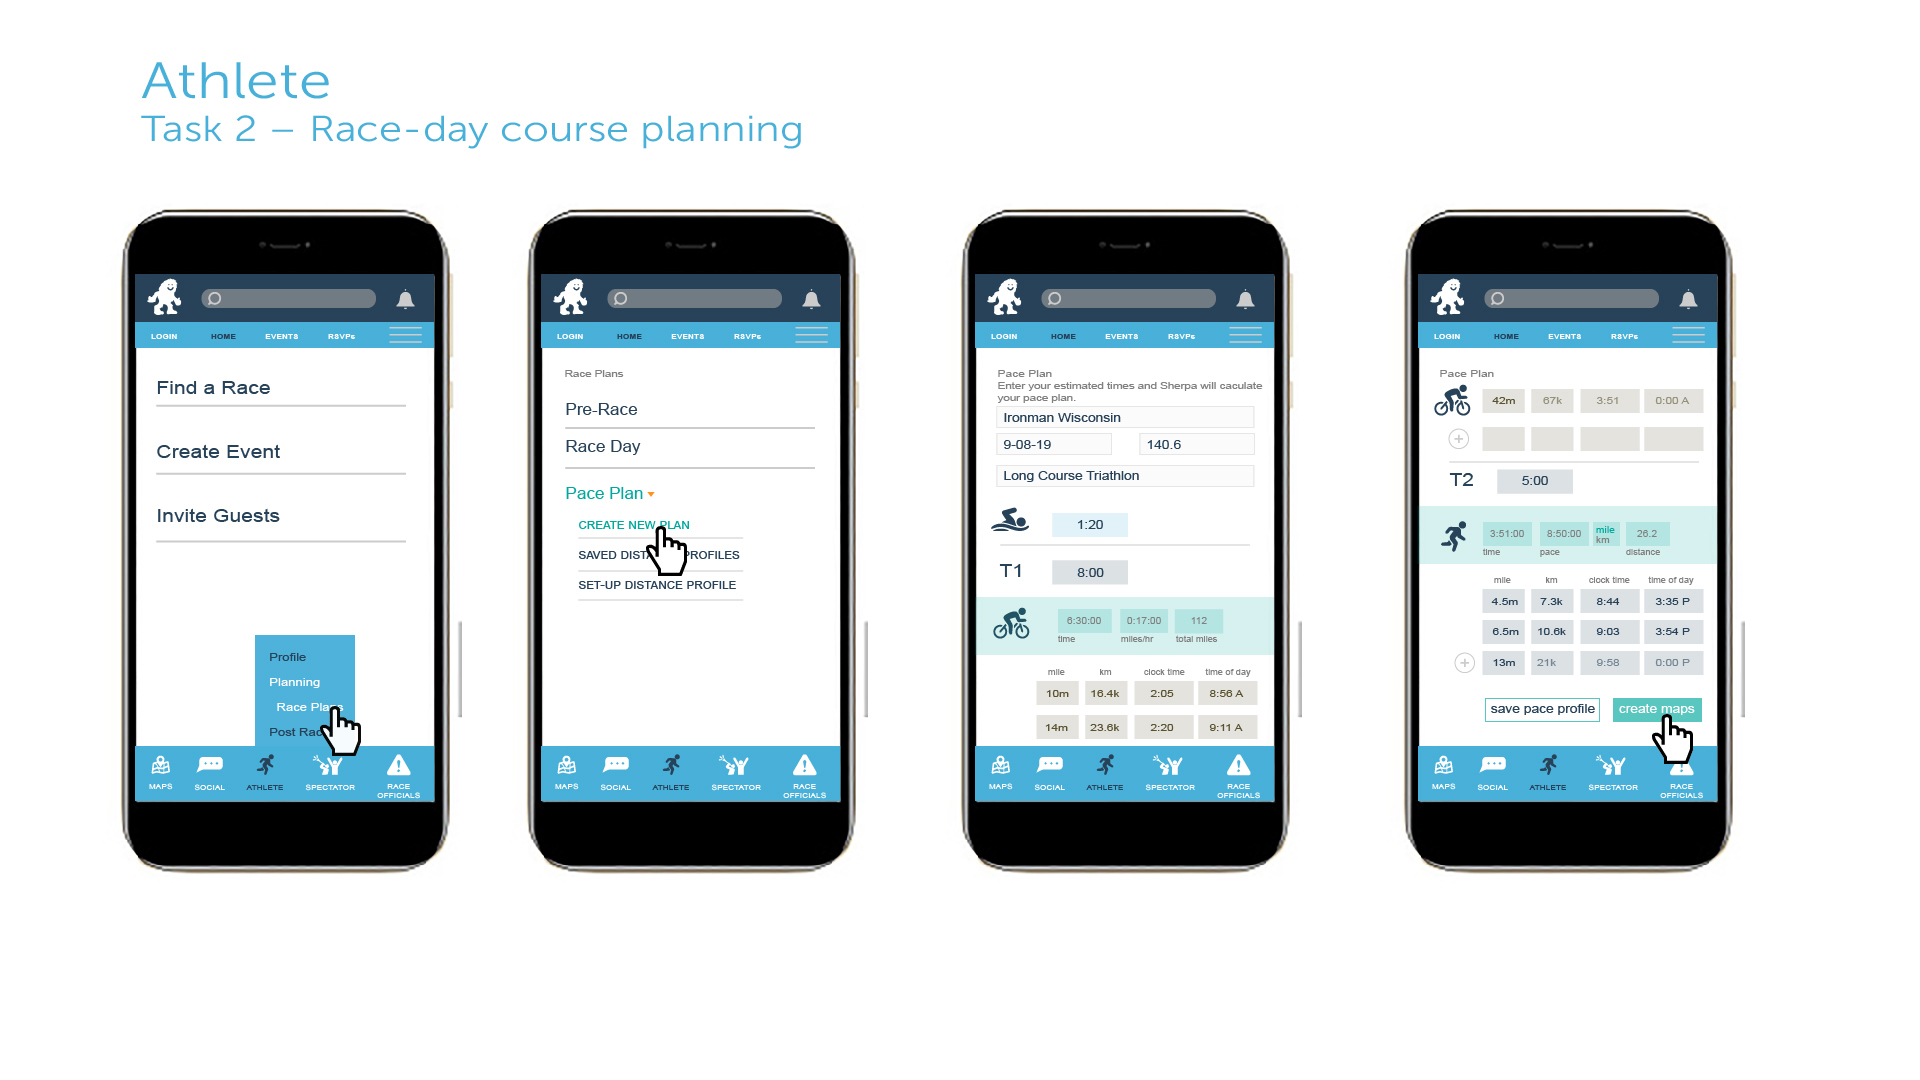
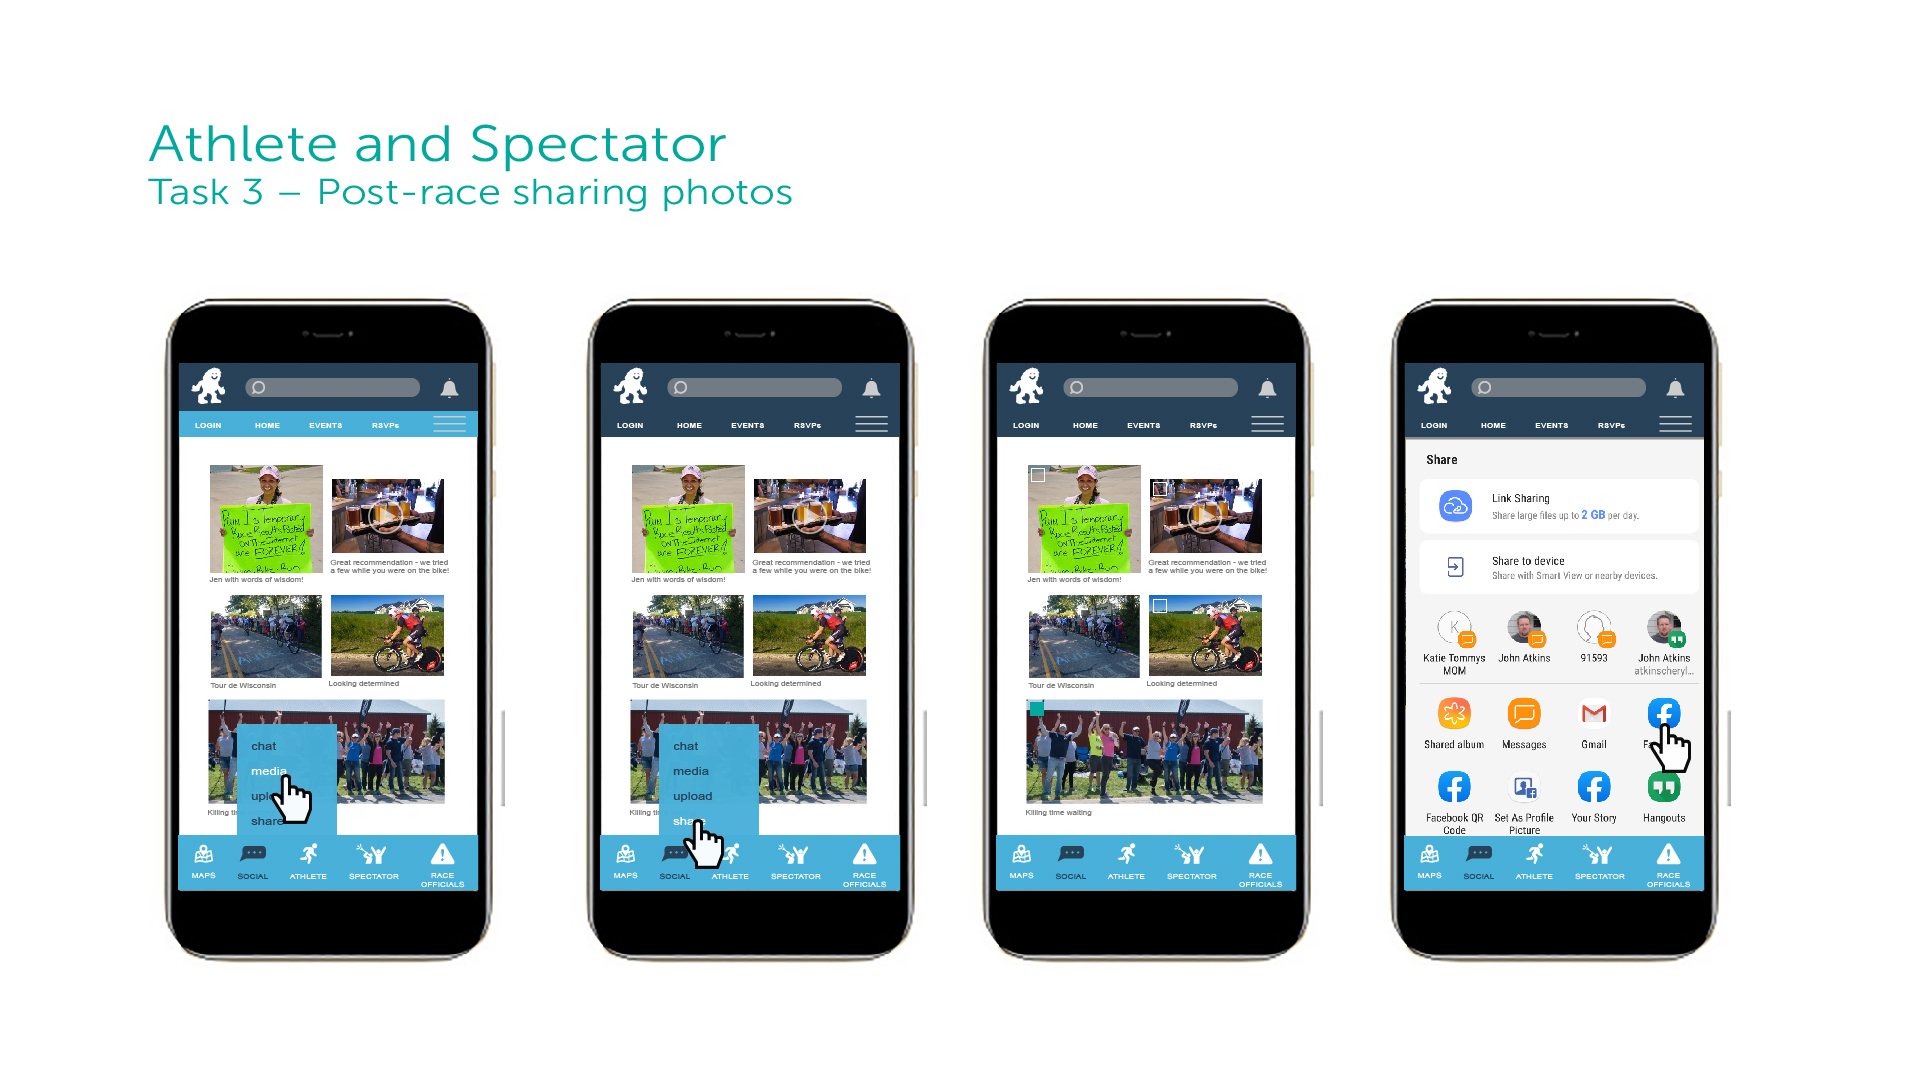
Task 3: Sharing the Experience
Athlete and Spectator Task - Sharing collected media to social outlets.
Proposed Features/Site Map
- Proposed features for each user.
- Draft site map created to depict possibilities within the endurance planning application.
Athletes:
• Create an event for each race
• Register for a race
• Book accommodations
• Centralized location for all event RSVPs
• Create/save race plans
• Create a pace plan and spectator maps
• Prepare notes for spectators for points of interest
• Invite and share the details in a single place
• Send RSVPs to event members for race activities
• Set/receive notifications for race goals while racing
• Store race results
• Receive play-by-play race recap generation
• Media Hub for all event photos shared by spectators
Spectators:
• Book accommodations
• RSVP for race day activities
• Centralized location for all RSVPs
• Review/edit spectator plan (Itineraries)
• Set/receive notifications on athlete progress
• Access course maps with live athlete tracking
• Receive alerts on when to leave for the next location
• Navigation based on the mode of transport
• Share photos to the Media Hub for all members to share during the day
• Post to social from the Media Hub

Conclusion
The research to date has provided significant contributions toward the next stage of product development. Further exploration is recommended on the following:
- Exploration with shorter distance races to determine the usefulness and engagement of each. Data would support expansion to varying race distances and new feature recommendations.
- Identify whether the athlete has unique needs during each stage and if they depend on the type of race. Data would support feature recommendations for customizable modules, allowing the user to re-use the workspace or create a unique workspace for the stage or type of race.
- Evaluate the spectator needs specific to customizable logistic planning features. Data would support feature recommendations for building their own map based on points of interest, number of times wishing to see an athlete, and location preference for viewing the race.
- Further research to support an additional audience, race management. Data would support communication functionality, allowing timely updates from race management helping to alleviate communication pain points for both athletes and spectators.
- Research on various types of spectator alerts beyond sight and sound when the athlete is approaching.
Technology Integration, Audience Expansion, and Revenue Generation Next Steps:
- Explore developing GPS and fitness technology integration to further improve the overall experience.
- Research integration opportunities from the Race Director and Race Management side.
- Explore how the application can be monetized from a sponsorship perspective.
